Attack Infrastructure Logging - Part 3 - Graylog Dashboard
Setting up a Graylog2 dashboard.
- Attack Infra Logging
- Graylog dashboards
- Setting up a dashboard
- Adding widgets
- Geolocation
- Conclusion
- References
Attack Infra Logging
- Part 1: Logging Server Setup
- Part 2: Log Aggregation
- Part 3: Graylog Dashboard 101
- Part 4: Log Event Alerting
The last 2 posts of this blog series had us setting up a logging server and aggregating logs into it from our various attack infrastructure assets. This brief post will go over setting up a dashboard to visualise the data from our incoming logs.
Graylog dashboards
Graylog dashboards allow you to build visual summaries or quick statistics from your infrastructure’s logs. There’s almost no limit to the type of data you’d like to display on a dashboard.
Setting up a dashboard
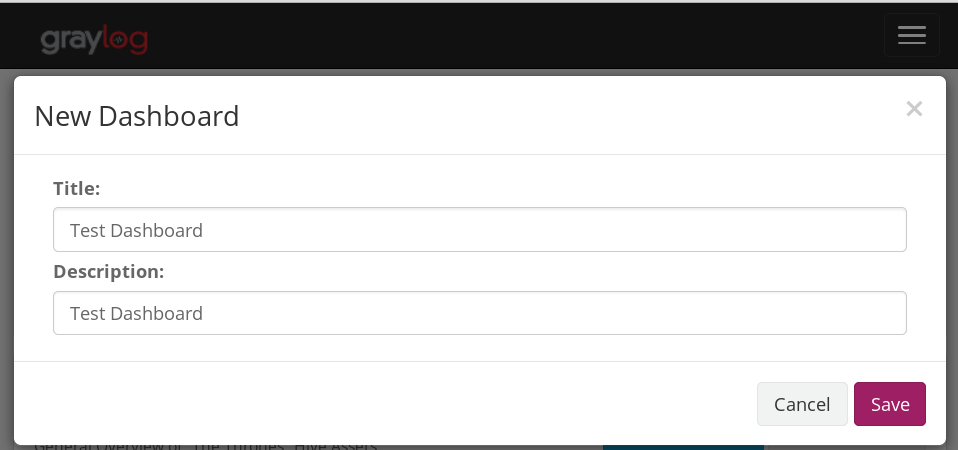
Head to the dashboards menu and click on “Create dashboard”. Name your dashboard, give it a description and save it once you’re done.
Great, we have a new and empty dashboard. Next, we’re going to add some widgets to it.
Adding widgets
Widgets can be added to your dashboard from Graylog’s Search menu. You can add statistical values, search result counts, IP address geolocation information (more on this later) and more.
A cool field to analyse and add to your dashboard would be the request field of your payload server. This will allow you see just how many times your payloads have been downloaded in a specific period of time.
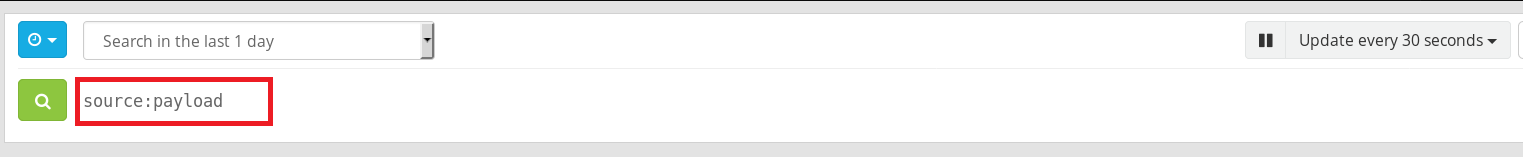
Head to your Search menu and in the search box enter “source:payload_server_hostname”, choose a time period you’d like to search within and hit enter. In the example below, my payload server’s hostname is “payload” and I’m searching for all logs within the last day.
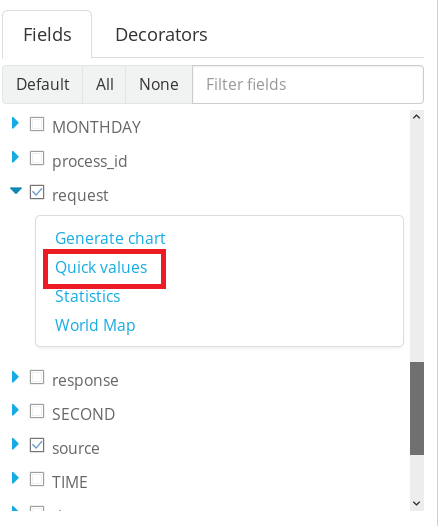
Next, scroll to the “request” checkbox in the Fields menu below your search box, expand it and click on “Quick values”
Graylog will automatically generate the values for you, inclusive of a pretty pie chart and percentages. We can see that evil.hta has been downloaded 18 times in the last 24 hours.
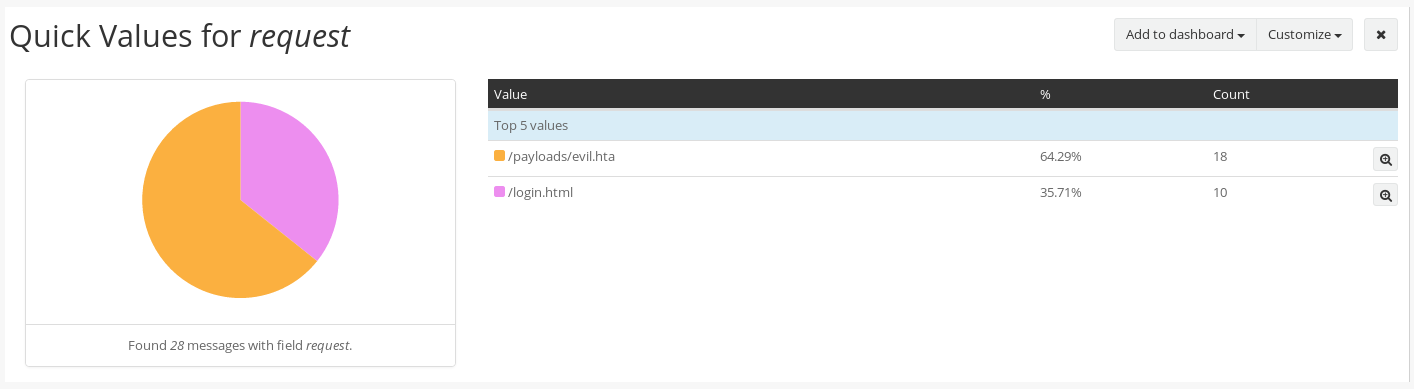
To add it to your dashboard, simply click the Add to dashboard button at the top right corner of the widget.
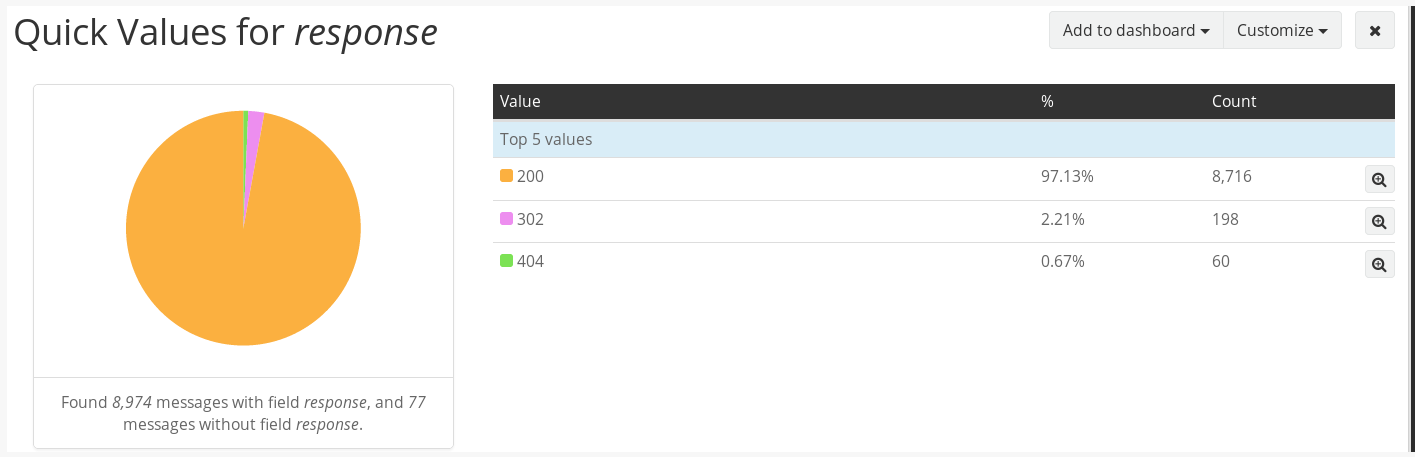
You can repeat this process for as many fields and log sources as you want. For example, if you want to see the top HTTP responses being generated by one of your redirectors, simply change the search to match a specific redirector (e.g. source:redirector1) and this time expand the response field.
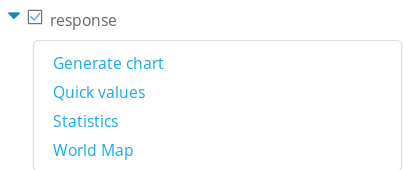
Click on Quick values again and let Graylog do all the hard work for you.
With a little imagination you could have a fancy looking dashboard to impress your colleagues and clients when reporting day comes around.
The more comfortable you are using Graylog’s search queries, the more creative you can be with your dashboard widgets.
A few examples of widgets to add to your dashboard:
- Top IP Addresses interacting with your web servers.
- Mail server statistics e.g. mails sent.
- Logs of successful phishes.
- Top countries interacting with your infrastructure.
- SSH logins to your infrastructure assets.
- Failed login attempts/brute force attacks.
Geolocation
Let’s face it; geolocating IP addresses on an interactive world map in real-time is pretty cool. I’m not ashamed to admit that it was one of my major motivations for setting up centralised logging; who doesn’t want to look like one of the hackers in all the movies?
This next section will quickly go over using Graylog’s geolocation features to add a world map to a dashboard.
You’ll need to download MaxMind’s Geolite2 city database:
cd /etc/graylog/server
sudo wget http://geolite.maxmind.com/download/geoip/database/GeoLite2-City.tar.gz
sudo tar xvf GeoLite2-City.tar.gz
NOTE: Make sure the database file is readable by Graylog.
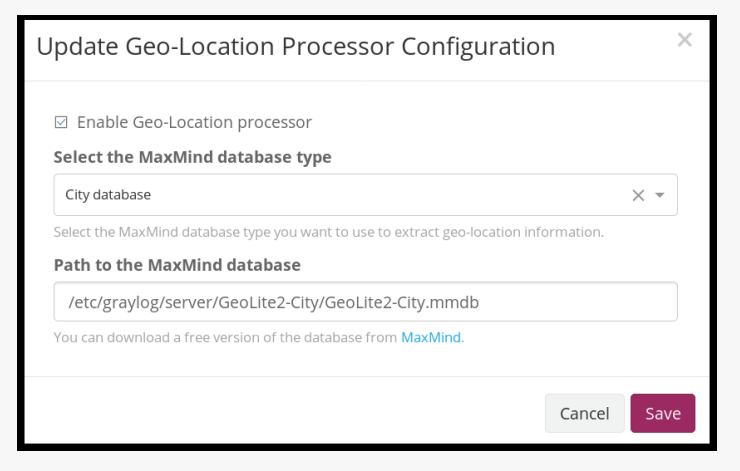
Next we need to enable Graylog’s geolocation features. Head to the System → Configurations menu and click on the Update button in the Geo-location Processor plugin section.
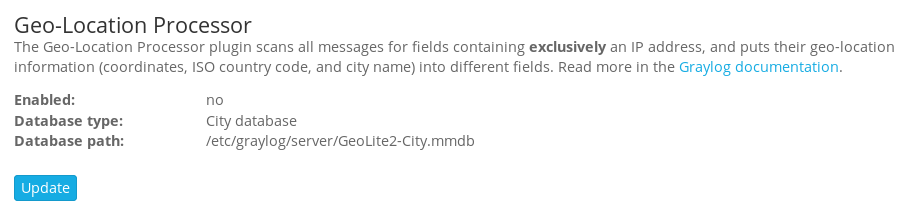
Enable the Geolocation processor and enter the full path to your geolocation database.
Once you’ve enabled the location processor; click on Update under the Message Processors Configuration section.
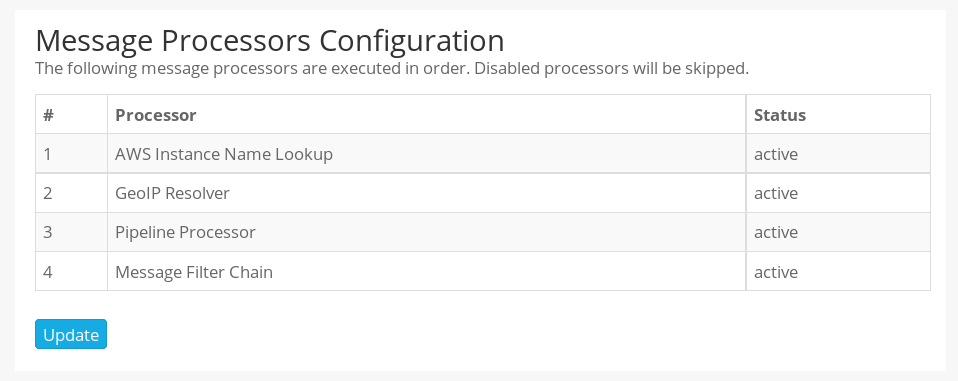
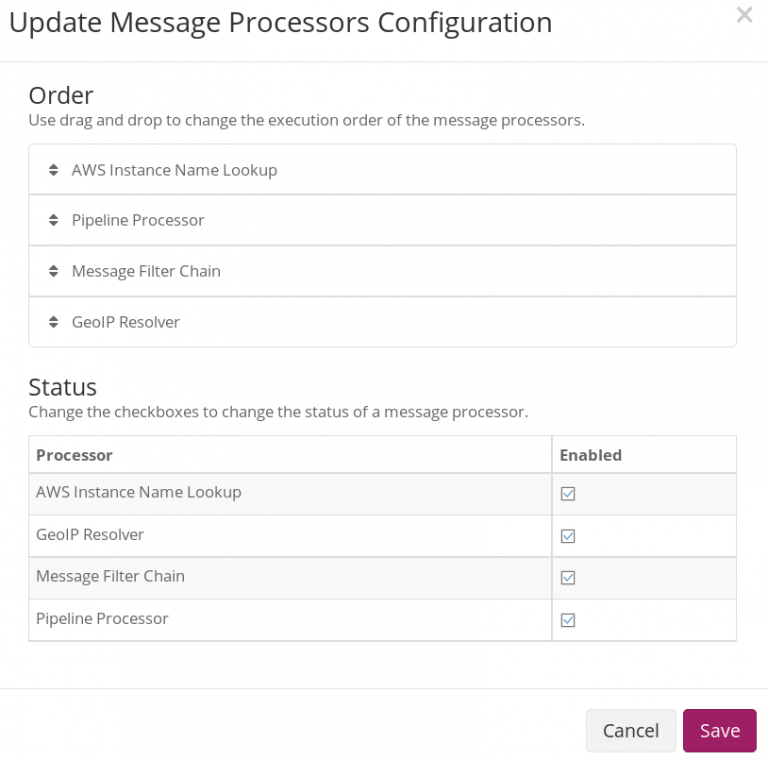
In the next screen, enable the GeoIP Resolver and drag its label to the bottom of the list of message processors. Your configuration should look similar to the one below once done.
We’re done. Graylog should automatically start extracting geolocation information from log fields that exclusively contain an IP address.
To test it, head to your search menu and search for logs from any of your sources that you know will contain an IP address e.g. Apache web requests.
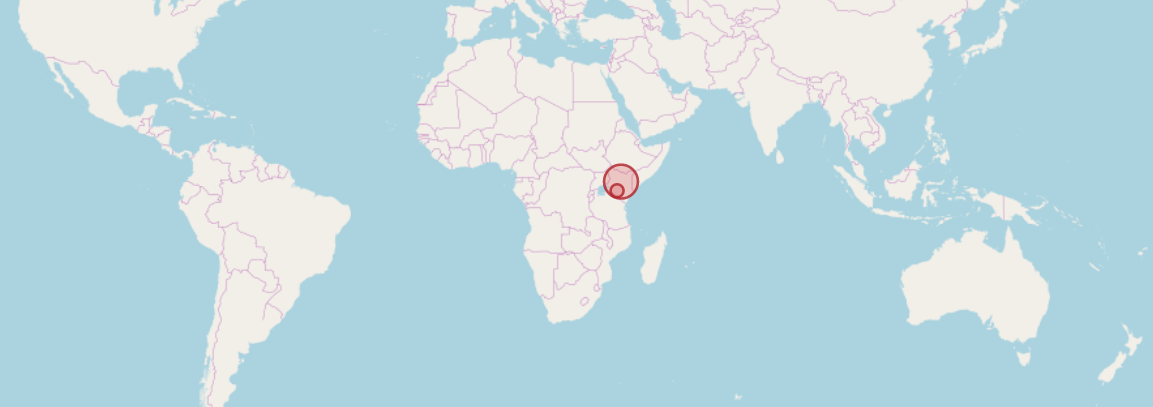
You should see the IP_geolocation checkbox in the Fields menu. Expand it and click on World Map.
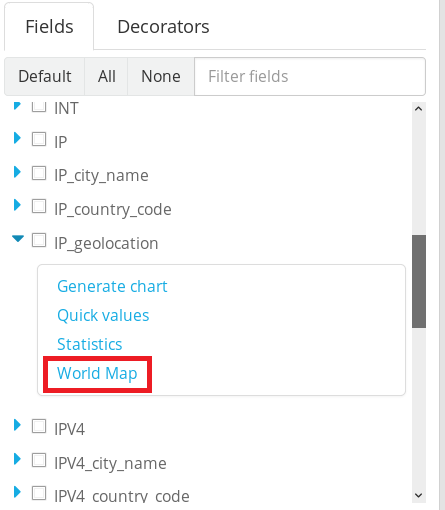
You should see all the IP addresses that have interacted with your log source pop up on a World map. You can now add it to your dashboard like any other widget.
Conclusion
Almost there. In the final post of this blog series, I’ll demonstrate how we can use Graylog’s alerting features to send attack infrastructure related events to Slack.