Attack Infrastructure Logging - Part 1 - Logging Server Setup
Graylog2 server setup.
Background
One of my goals this year was to improve my infrastructure log management procedures during engagements. Up until quite recently my log management technique was opening a couple of terminal tabs, SSH-ing into all my infrastructure assets and cat-ing, tailf-ing and grepping the log files I was interested in. As you can imagine this wasn’t particularly efficient, but I was happily content with it until I read this great blog post written by Jeff Dimmock and Steve Borosh. Now all of a sudden my infrastructure log management expertise seemed pretty inadequate and a little voice in my head kept nagging me to do something about it.
This blog post series will be a guide to setting up centralised infrastructure logging, monitoring and alerting for long-term engagements. It’s a pretty wide topic so I won’t be able to cover everything it entails (I’m pretty new to it myself), but it should provide a good starting point for anyone looking to setup something similar.
Attack Infra Logging
- Part 1: Logging Server Setup
- Part 2: Log Aggregation
- Part 3: Graylog Dashboard 101
- Part 4: Log Event Alerting
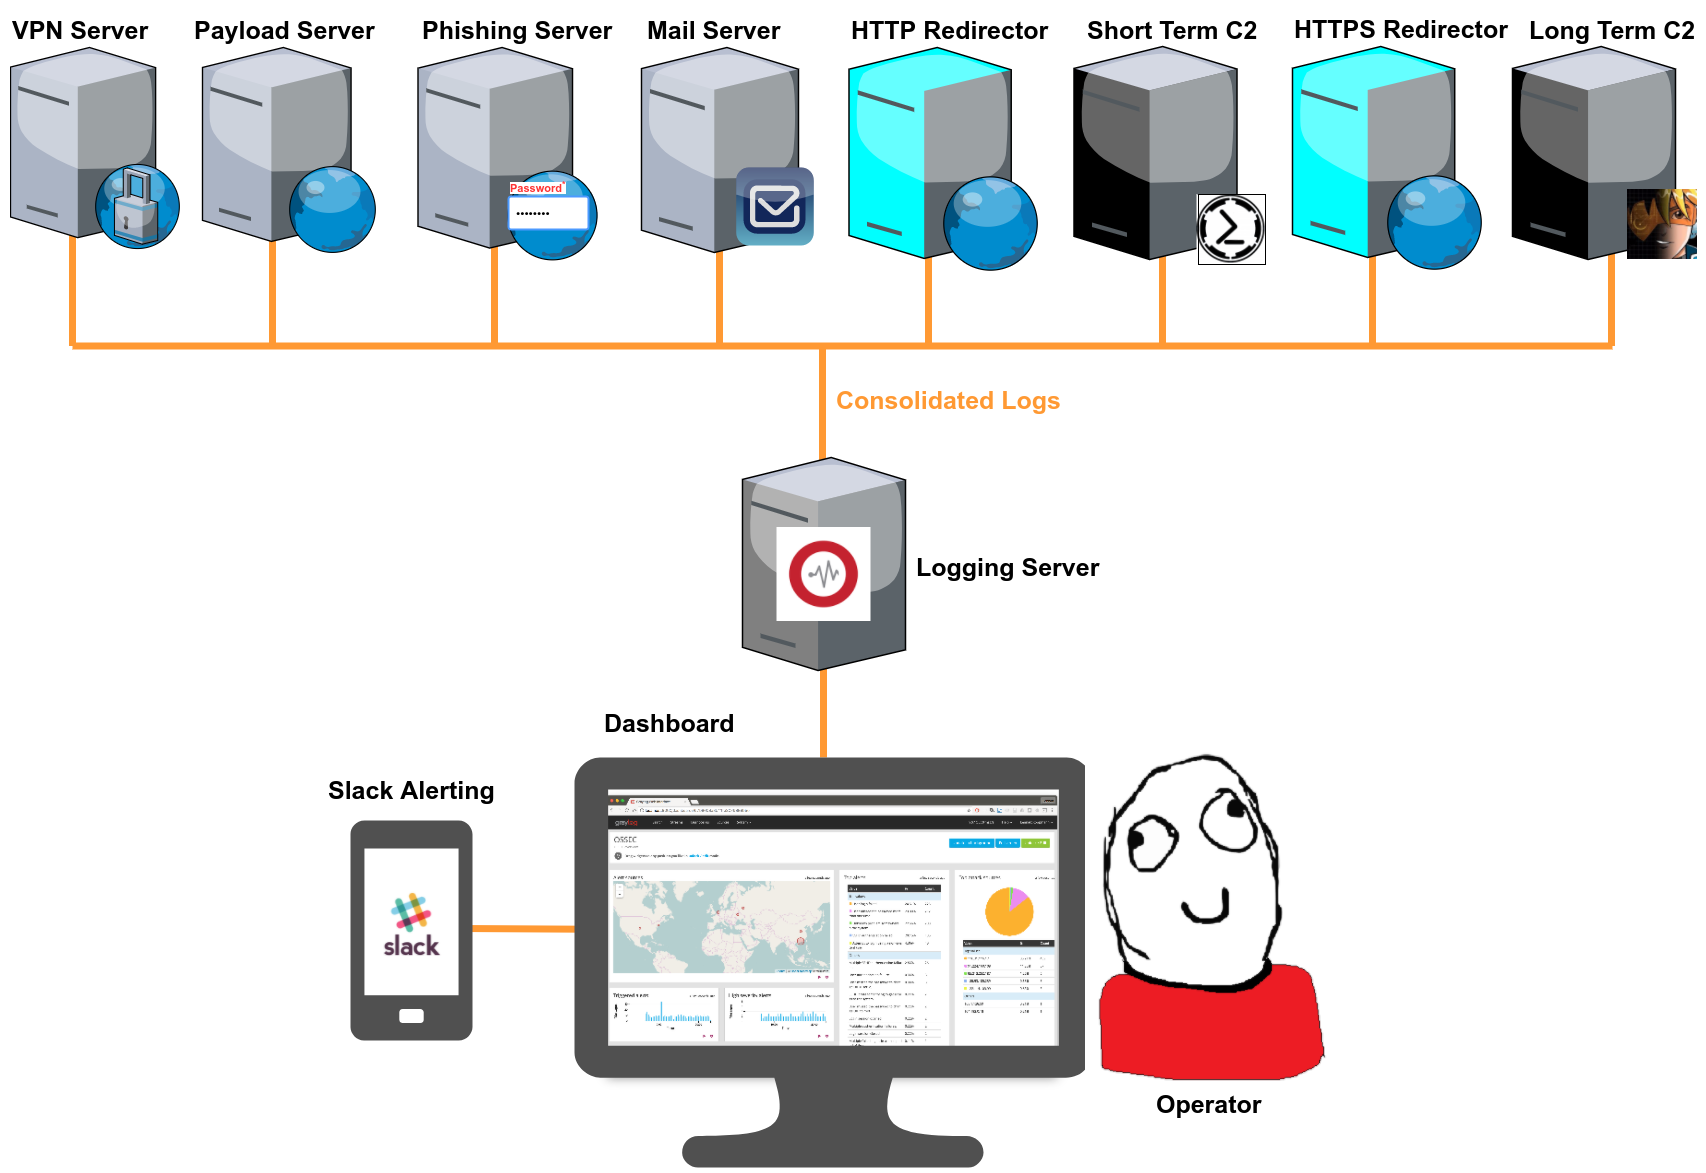
By the end of this series we should end up with a logging setup that looks something like this.
Why log? Why centralise? Why monitor?
To be honest, the typical 2 week-long compliance pentest doesn’t require much investment in infrastructure setup or log management. But if you’re standing up infrastructure for a long term engagement (months/years), you should consider investing a little more time in setting up centralised logging for a few reasons:
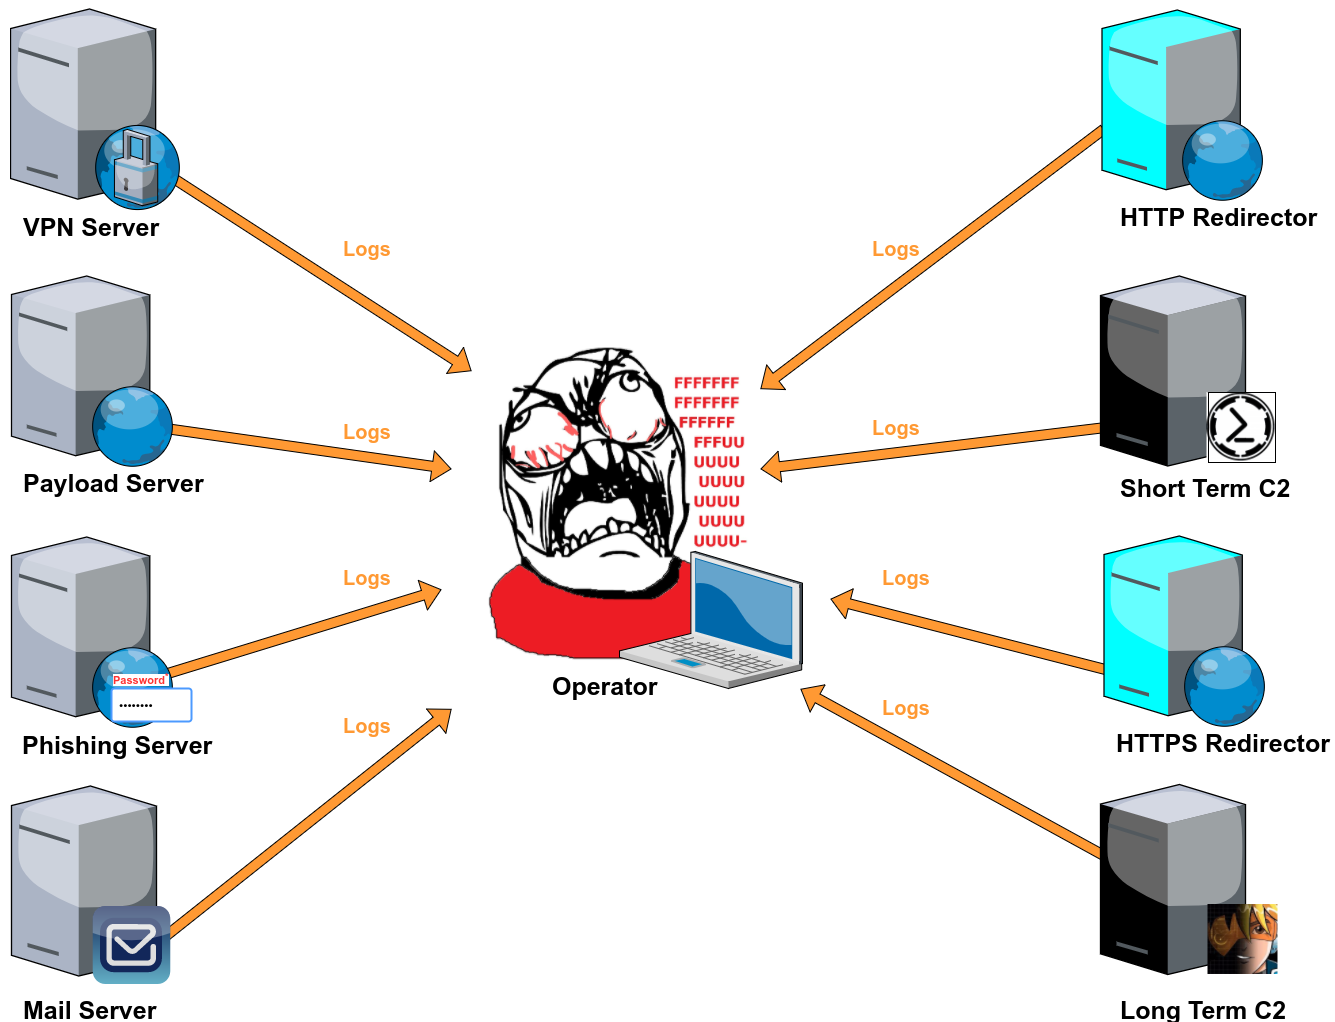
- Operational oversight - Centralised logging gives you a bird’s-eye view of on-going operations; successful phishes, payload downloads, potential incident response activity, attacks on your assets and more. Having this oversight will allow you to respond to events immediately they occur or even adjust your tactics on the fly e.g. say your log alerts tell you that your payload has been downloaded 10 times in the last 8 hours and you haven’t gotten a single shell; that should definitely raise some red flags in the next team meeting.
- Reporting - Good logs increase the quality of your reporting. I’m sure we’re all guilty of missing that one screenshot that would have really helped drive the point home.
- Convenience & efficiency -Monitoring logs from multiple infrastructure assets can be a real pain. A centralised dashboard configured with customised quick statistics and alerts has saved me a lot of time and effort.
- Accountability -You should know and have evidence of the activities you’re responsible for. There are horror stories out there of pentesters being blamed for things they didn’t do.
- Security -For the internet is dark and full of terrors. The blue team is monitoring their infrastructure logs for anomalies and signs of malicious activity, why shouldn’t you?
Logging server setup
Graylog2
I’ll be using Graylog2 as the centralised logging server throughout this blog series, but I should mention that there are PLENTY of alternatives out there.
I picked Graylog for the reasons listed below, but feel free to experiment with other log management solutions:
- It’s open source and free for less than 5GB of logs a day. That’s more than enough for the average pentester/red teamer.
- It’s really well documented.
- It comes loaded with lots of features out-of-the-box and has plenty of additional plugins to choose from if you want to add functionality to it.
- It supports Slack alerting.
With that said, we can get right into setting up a brand new Graylog logging server.
1. Server requirements
Graylog has a few prerequisites that I’ll cover installing. As for the logging server itself, I’d recommend something with at least 4GB RAM for a comfortable operating experience; Graylog is built on top of ElasticSearch which alone requires 2GB of RAM to run. Graylog’s documentation covers installation for various OS flavors. I’ll be using a fresh Debian 9 system.
2. Prerequisites
Graylog has a few prerequisites that I’ll cover installing. As for the logging server itself, I’d recommend something with at least 4GB RAM for a comfortable operating experience; Graylog is built on top of ElasticSearch which alone requires 2GB of RAM to run. Graylog’s documentation covers installation for various OS flavors. I’ll be using a fresh Debian 9 system.
Graylog has the following dependencies:
- Java (>= 8)
- MongoDB (>= 2.4)
- Elasticsearch (>= 2.x)
Let’s install them.
# Java
sudo apt update && sudo apt upgrade
sudo apt install apt-transport-https openjdk-8-jre-headless uuid-runtime pwgen

# MongoDB
sudo apt-key adv --keyserver hkp://keyserver.ubuntu.com:80 --recv 2930ADAE8CAF5059EE73BB4B58712A2291FA4AD5
echo "deb http://repo.mongodb.org/apt/debian jessie/mongodb-org/3.6 main" | sudo tee /etc/apt/sources.list.d/mongodb-org-3.6.list
sudo apt-get update && sudo apt-get install -y dirmngr mongodb-org
NOTE: You may have to install the libssl1.0.0 package if installing MongoDB fails. To do this, add Debian’s jessie-backports below to your /etc/apt/sources.list:
# Jessie backports
deb http://ftp.debian.org/debian jessie-backports main
Or you could just download and install the missing dependency yourself.
Next dependency up for installation is ElasticSearch.
# Elasticsearch

wget -qO - https://artifacts.elastic.co/GPG-KEY-elasticsearch | sudo apt-key add -
echo "deb https://artifacts.elastic.co/packages/5.x/apt stable main" | sudo tee -a /etc/apt/sources.list.d/elastic-5.x.list
sudo apt-get update && sudo apt-get install elasticsearch
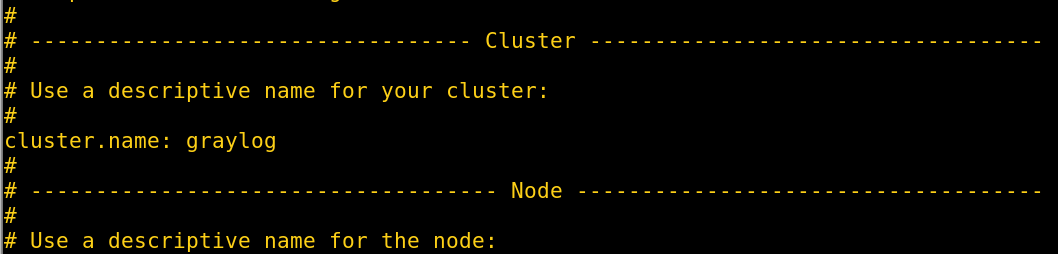
Once ElasticSearch is installed you’ll need to modify the ElasticSearch configuration file (/etc/elasticsearch/elasticsearch.yml); uncomment the cluster.name setting and name it graylog.
Lastly, enable all the required services to start on boot and restart them.
sudo systemctl daemon-reload
sudo systemctl enable mongod.service elasticsearch.service
sudo systemctl restart mongod.service elasticsearch.service
3. Install Graylog2
Graylog offers DEB and RPM package repositories.
wget https://packages.graylog2.org/repo/packages/graylog-2.4-repository_latest.deb
sudo dpkg -i graylog-2.4-repository_latest.deb
sudo apt-get update
sudo apt-get install graylog-server
4. Configuring Graylog2
Graylog offers DEB and RPM package repositories.
All of Graylog’s configuration is managed from a single file; /etc/graylog/server/server.conf. We’ll need to change a few settings in it before we can login to Graylog’s web administration portal.
I always backup configuration files before I start messing with them; you never know when you’ll need a fresh start.
sudo cp /etc/graylog/server/server.conf /etc/graylog/server/server.conf.bak
i) Administrator’s username
Change your administrator’s username if you want to, the default is “admin”.
root_username = admin
ii) password_secret
You have to set a secret key for password encryption and salting. Graylog will refuse to start if it’s not set. This ISN’T going to be your login password.
First, generate an encryption secret using the pwgen utility (at least 64 characters long):
pwgen -N 1 -s 96
Paste the entire string in the password_secret setting:
password_secret = GENERATED_SECRET
iii) root_password_sha2
Next you need to generate a SHA2 hash of the password you will use for your initial login to Graylog’s web interface. You can change it from the dashboard after your first login.
Generate a SHA2 hash of your administrator account’s password:
echo -n yourpassword | sha256sum
Paste the hash in the root_password_sha2 setting:
root_password_sha2 = PASSWORD_HASH
iv) Web listening port
Lastly, you should enable the web interface and change its listening port if you want to use anything other than the default 9000. Uncomment the lines below and change them to match whatever port you want Graylog’s web interface to be reachable on.
rest_listen_uri = http://0.0.0.0:9000/api/
web_listen_uri = http://0.0.0.0:9000/api/
Now all you have to do is enable and restart the Graylog service.
sudo systemctl daemon-reload
sudo systemctl enable graylog-server.service
sudo service graylog-server restart
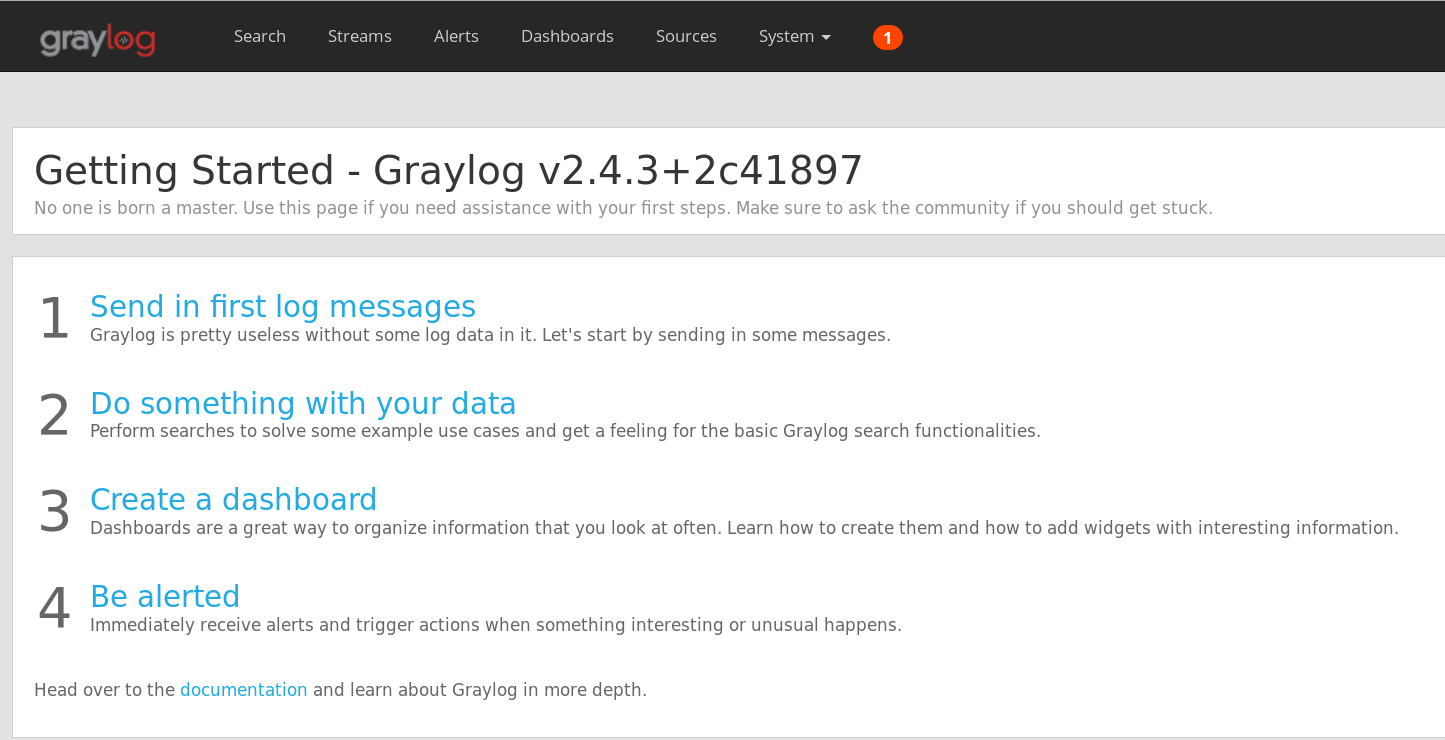
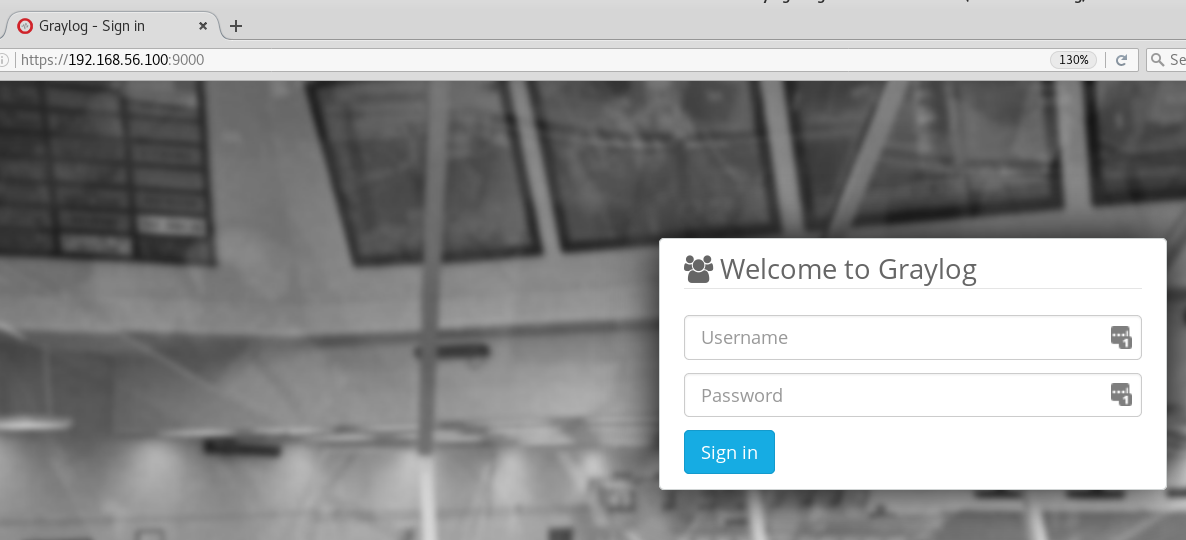
Login to your web administration portal at http://[IP_ADDRESS]:9000/
IMPORTANT: The next step is optional but I’d HIGHLY recommend not skipping it. Graylog’s web interface and REST API use HTTP by default, meaning your password and other sensitive data is sent over the wire in cleartext. The next step covers generating and adding a self-signed HTTPS certificate to your Graylog installation.
v) Install a self-signed certificate
Create a folder to manage your certificates and navigate to it.
sudo mkdir /etc/graylog/server/ssl
cd /etc/graylog/server/ssl
Create the file openssl-graylog.cnf in it and fill it with the content below; customise it to suit your needs.
# file: "openssl-graylog.cnf"
[req]
distinguished_name = req_distinguished_name
x509_extensions = v3_req
prompt = no

# Details about the issuer of the certificate
[req_distinguished_name]
C = US
ST = NY
L = NY
O = Graylog
OU = Graylog
CN = logger.graylog.com

[v3_req]
keyUsage = keyEncipherment, dataEncipherment
extendedKeyUsage = serverAuth
subjectAltName = @alt_names

# IP addresses and DNS names the certificate should include
# Use IP.### for IP addresses and DNS.### for DNS names,
# with "###" being a consecutive number.
[alt_names]
IP.1 = 127.0.0.1
DNS.1 = logger.graylog.com
NOTE: Make sure you change the “IP.1=127.0.0.1” value in your configuration file to the IP address of your Graylog server.
Create a PKCS#5 private key (pkcs5-plain.pem) and X.509 certificate (graylog.crt).
sudo openssl req -x509 -days 365 -nodes -newkey rsa:2048 -config openssl-graylog.cnf -keyout pkcs5-plain.pem -out graylog.crt
Convert your PKCS#5 private key into an unencrypted PKCS#8 private key (graylog.key).
sudo openssl pkcs8 -in pkcs5-plain.pem -topk8 -nocrypt -out graylog.key
When using HTTPS for the Graylog REST API, the X.509 certificate (graylog.crt in this case) must be trusted by the JVM trust store, otherwise communication will fail. Since we don’t want to mess with the official trust store, we’ll make a copy of it which we will use with our Graylog certificate.
sudo cp -a /usr/lib/jvm/java-8-openjdk-amd64/jre/lib/security/cacerts /etc/graylog/server/ssl/
sudo keytool -importcert -keystore /etc/graylog/server/ssl/cacerts -storepass changeit -alias graylog-self-signed -file /etc/graylog/server/ssl/graylog.crt
The certificates should now be ready for use. Edit Graylog’s config file (/etc/graylog/server/server.conf) and find and change the settings below:
# file: "/etc/graylog/server/server.conf"
# REST API settings
rest_enable_tls = true
rest_tls_cert_file = /etc/graylog/server/ssl/graylog.crt
rest_tls_key_file = /etc/graylog/server/ssl/graylog.key

# Web interface settings
web_enable_tls = true
web_tls_cert_file = /etc/graylog/server/ssl/graylog.crt
web_tls_key_file = /etc/graylog/server/ssl/graylog.key
NOTE: Make sure you change the “IP.1=127.0.0.1” value in your configuration file to the IP address of your Graylog server.
We’re done! Just restart Graylog and you should be able to login to your administration console at https://[IP-ADDRESS]:9000/
sudo service graylog-server restart
If you have any issues logging in, refer to Graylog2’s HTTPS setup documentation and Graylog’s log file (/var/log/graylog-server/server.log) for troubleshooting purposes.
Automation
If you’ve gotten this far, you can tell that installing Graylog can be a bit of a process, especially if you’re the type to spin up fresh infrastructure for every engagement. I wrote a script to automate all of the installation steps above.
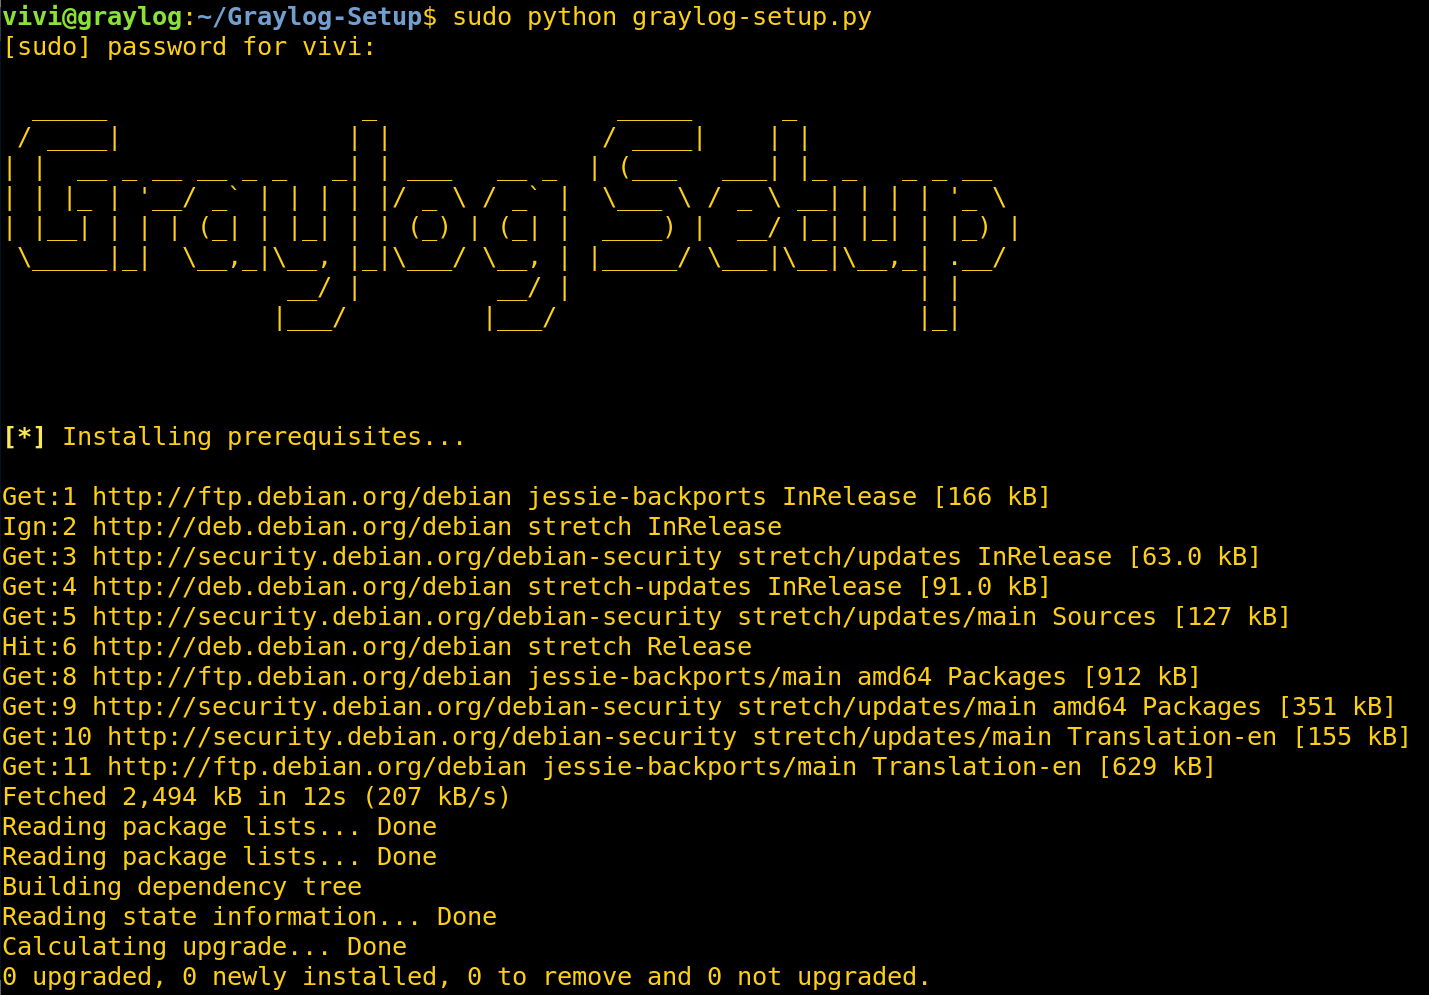 Install dependencies.
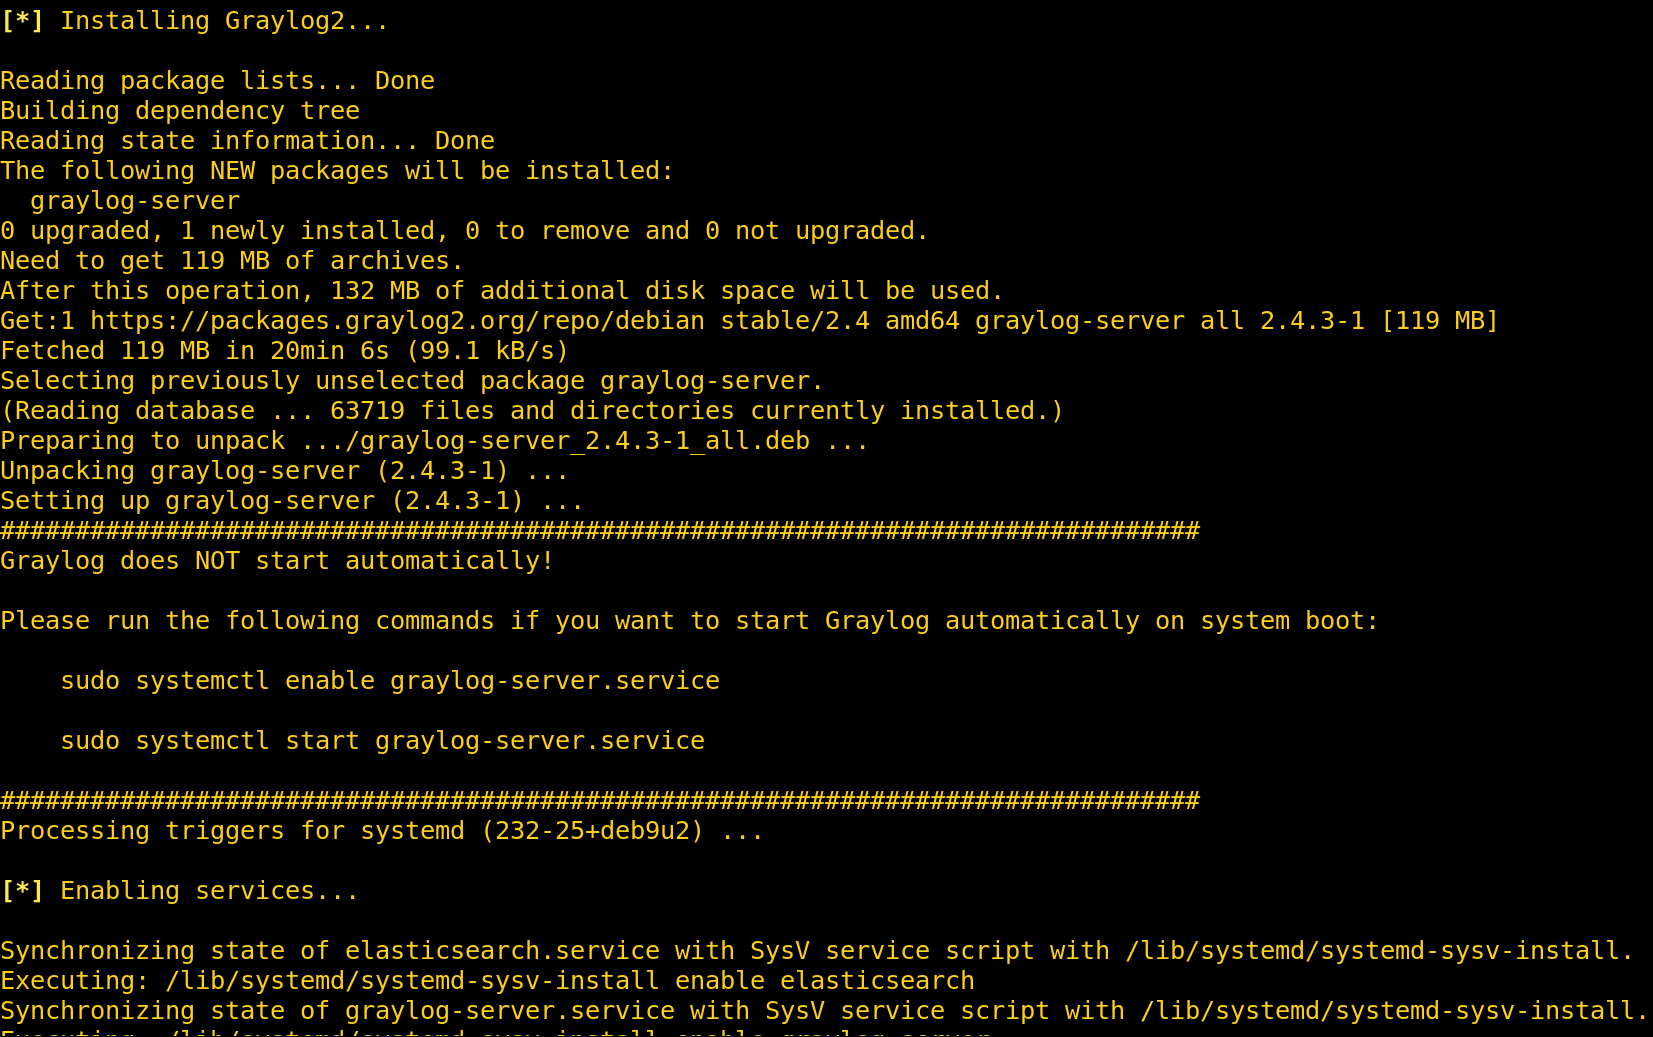 Install Graylog.
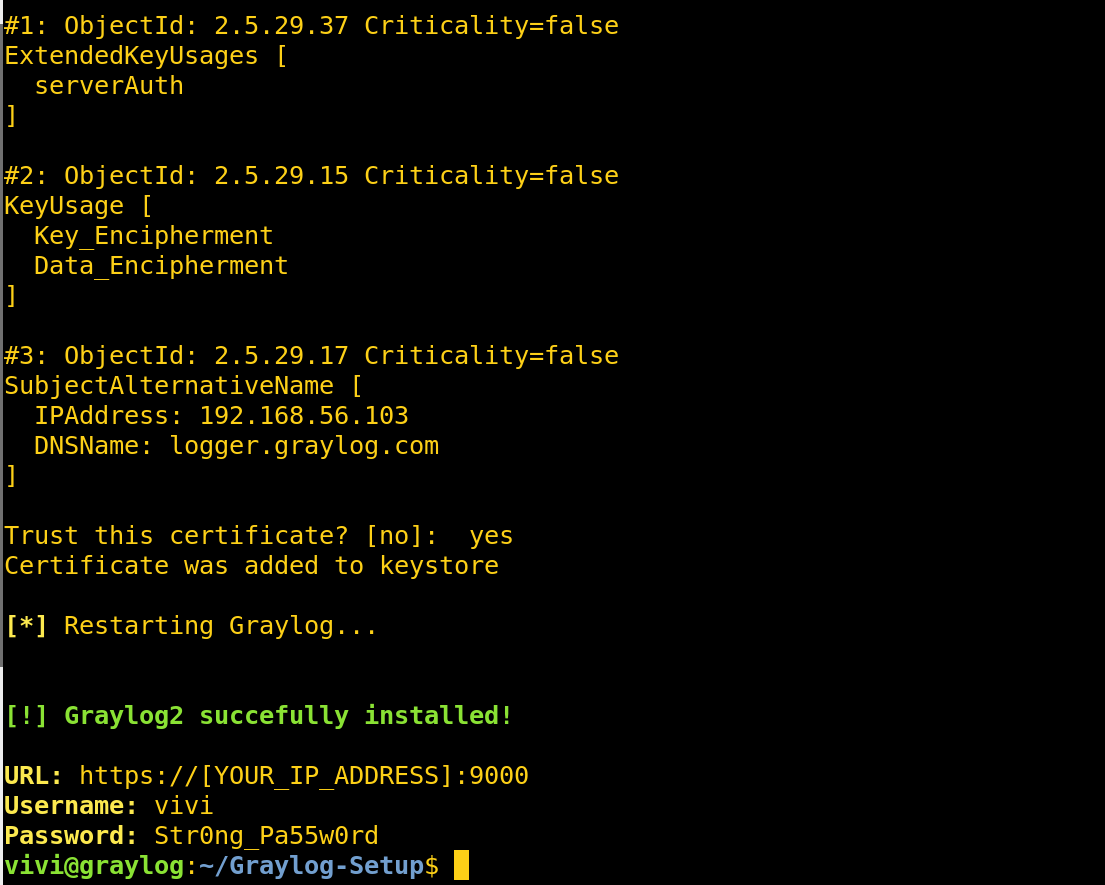 Configure HTTPS.
Securing Graylog
You should understand the risks of having all the logs from your attack infrastructure centralised in one place. The more the logs you aggregate, the higher the risk your logging server carries; a single compromise could expose your entire operation.
The table below shows Graylog’s default listening ports.
| Service | Port |
|---|---|
| Graylog Web Interface & REST API | 9000 |
| Graylog to ElasticSearch | 9200 |
| ElasticSearch Node Communication | 9300 |
| MongoDB | 27017 |
Some simple firewall rules can go a long way in securing your Graylog installation, especially if you use a VPN server to control access to the administration ports of your attack infrastructure.
Here’s a sample of some iptables rules you can apply to your Graylog server to limit its attack surface.
# Default policies
-P INPUT DROP
-P FORWARD DROP
-P OUTPUT ACCEPT

# Allow established connections
-A INPUT -m state --state RELATED,ESTABLISHED -j ACCEPT

# Allow traffic originating on the local loopback interface
-A INPUT -i lo -j ACCEPT

# Only allow SSH connections from a specific IP address e.g. VPN
-A INPUT -s [VPN_IP_ADDRESS]/32 -p tcp -m tcp --dport 22 -j ACCEPT

# Only allow connections to Graylog administration from a specific IP address e.g. VPN
-A INPUT -s [VPN_IP_ADDRESS]/32 -p tcp -m tcp --dport 9000 -j ACCEPT

# Only allow Rsyslog communication from attack infrastructure assets (1 line per asset)
-A INPUT -s [ASSET_IP_ADDRESS]/32 -p tcp -m tcp --dport 5140 -j ACCEPT
-A INPUT -s [ASSET_IP_ADDRESS]/32 -p tcp -m tcp --dport 5140 -j ACCEPT
-A INPUT -s [ASSET_IP_ADDRESS]/32 -p tcp -m tcp --dport 5140 -j ACCEPT
-A INPUT -s [ASSET_IP_ADDRESS]/32 -p tcp -m tcp --dport 5140 -j ACCEPT
NOTE: The last section of the ruleset above will make more sense in the next post.
Conclusion
Our logging server is up and running, in the next post I’m going to go over setting up the aggregation of logs from various infrastructure assets.
References
- https://github.com/bluscreenofjeff/Red-Team-Infrastructure-Wiki
- https://bluescreenofjeff.com/2017-08-08-attack-infrastructure-log-aggregation-and-monitoring/
- https://www.contextis.com/blog/logging-like-a-lumberjack
- http://docs.graylog.org/en/2.4/index.html
- http://docs.graylog.org/en/2.4/pages/configuration/server.conf.html
- http://docs.graylog.org/en/2.4/pages/configuration/file_location.html#default-file-location
- https://ashleyhindle.com/how-to-setup-graylog2-and-get-logs-into-it/
- https://dodizzle.wordpress.com/2011/10/14/3-ways-to-push-data-to-graylog2/