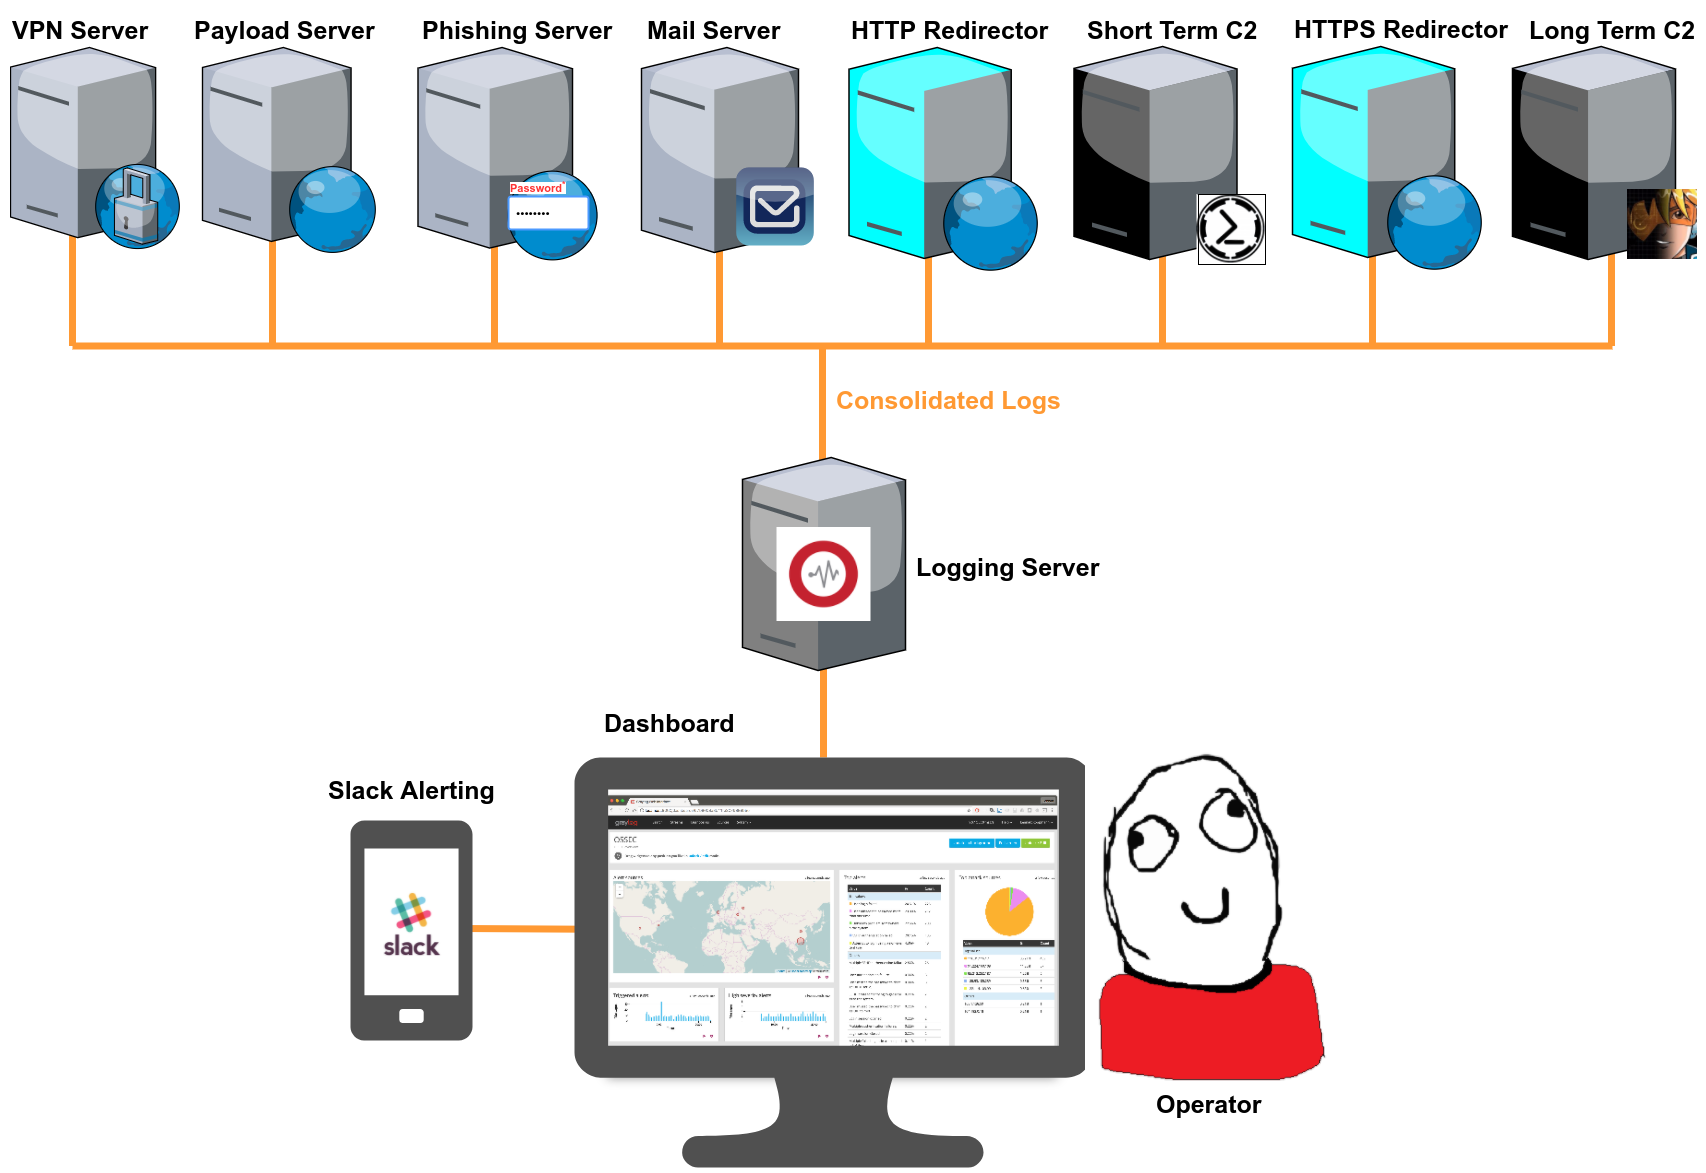
Attack Infrastructure Logging - Part 2 - Log Aggregation
Configuring log aggregation in Graylog2.
- Attack Infra Logging
- Message inputs (Rsyslog)
- Server - Graylog inputs
- Client - Apache logs
- Server - Log parsing
- Client - Mail logs
- Extra - C2 logs
- Conclusion
- References
Attack Infra Logging
- Part 1: Logging Server Setup
- Part 2: Log Aggregation
- Part 3: Graylog Dashboard 101
- Part 4: Log Event Alerting
In my previous post I covered setting up a Graylog2 logging server. In this post, we’re going to start getting some logs from our infrastructure assets into our Graylog installation.
The number and type of infrastructure assets used varies for each pentester/red teamer so it’s impossible to go over all possible log sources in one post. However, the process is more or less the same for a lot of technologies and this post should help you understand the overall methodology.
I’m going to cover setting up log aggregation for:
- An Apache payload/phishing/C2 redirector server.
- A Postfix/Sendmail mail server.
Message inputs (Rsyslog)
Before I get into setting up log aggregation I should say something about Graylog’s message inputs and Rsyslog:
- Message inputs are what Graylog uses to ingest incoming log messages.
- Rsyslog is the rocket-fast system for log processing. It’s a *nix based utility (usually preinstalled) used for forwarding log messages over a network (via TCP or UDP). It’s what we’re going to use to forward logs from our infrastructure assets (aka clients) to Graylog.
Server - Graylog inputs
We can’t start forwarding logs from our clients until we fire up a Graylog input to ingest these logs.
Message Input configuration in Graylog is really simple. They are launched from the web interface in the System → Inputs menu.
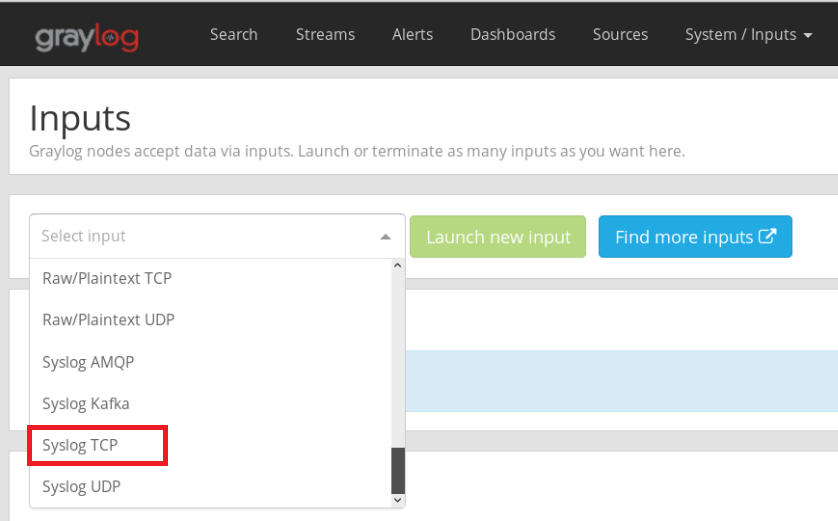
Graylog supports a lot of message input types. As I mentioned earlier, we’re going to be using Rsyslog so, select “Syslog TCP” and click on “Launch new input” when done.
Most of the settings in the next screen are optional, just give your new input a name and select the bind port you’ll be using (your Graylog server will create a listening service to ingest logs on this port). Rsyslog uses port 514 by default, I’d recommend using a separate high port (>1024) like 5140 in the example below.
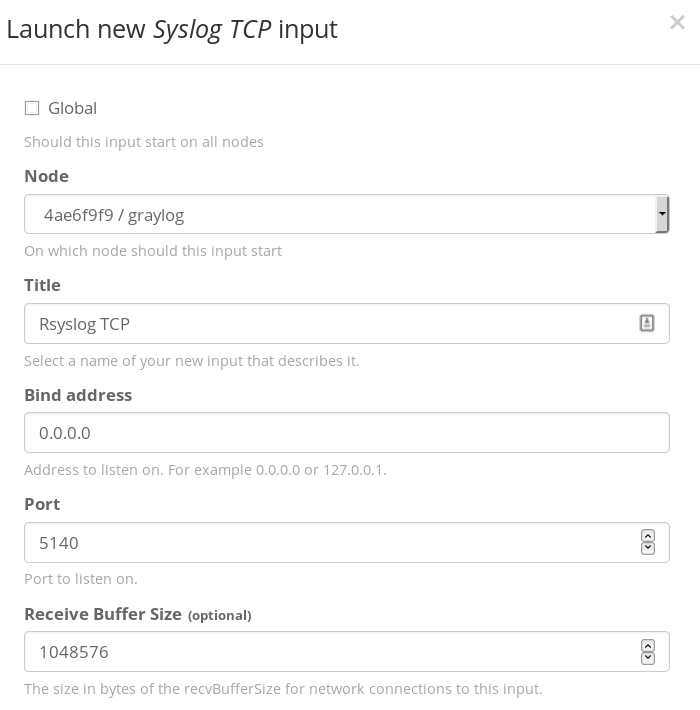
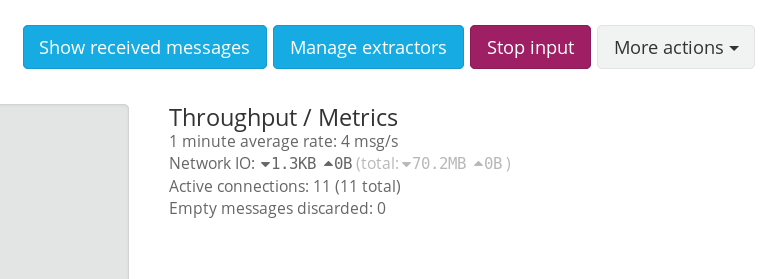
Once it’s configured, hit Start Input to fire it up.
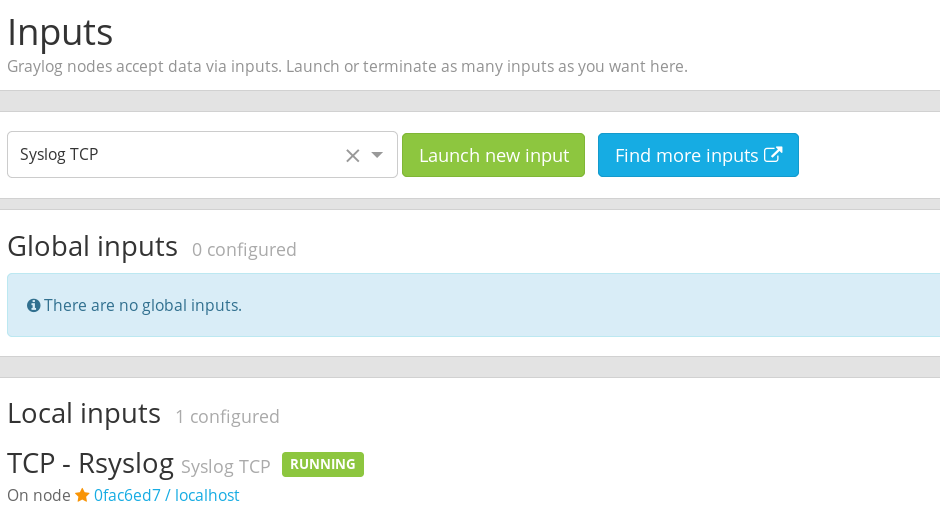
Now we can start sending some logs from our clients to Graylog.
Client - Apache logs
Login to your Apache webserver and create the file /etc/rsyslog.d/apache.conf. Paste the text below into it:
# file: "/etc/rsyslog.d/apache.conf"
$ModLoad imfile

# Default Apache Error Log
$InputFileName /var/log/apache2/error.log
$InputFileTag apache-error-default:
$InputFileStateFile stat-apache-error
$InputFileSeverity info
$InputFileFacility local3
$InputRunFileMonitor

# Default Apache Access Log
$InputFileName /var/log/apache2/access.log
$InputFileTag apache-access-default:
$InputFileStateFile stat-apache-access
$InputFileSeverity info
$InputFileFacility local4
$InputRunFileMonitor

$InputFilePollInterval 1
Next, open /etc/rsyslog.conf and paste the text below at the bottom of the file.
# file: "/etc/rsyslog.conf"
$WorkDirectory /var/spool/rsyslog
$ActionQueueFileName fwdRule1
$ActionQueueMaxDiskSpace 1g
$ActionQueueSaveOnShutdown on
$ActionQueueType LinkedList
$ActionResumeRetryCount -1
*.* @@graylog.example.org:5140;RSYSLOG_SyslogProtocol23Format
local3.* @@graylog.example.org:5140;RSYSLOG_SyslogProtocol23Format
local4.* @@graylog.example.org:5140;RSYSLOG_SyslogProtocol23Format
Replace the all occurrences of “graylog.example.org:5140” with the IP address/domain of your Graylog server and the port of your message input.
We’re done, now all you have to is start the Rsyslog service and your Apache webserver should start forwarding its logs to Graylog.
sudo service syslog stop
sudo service rsyslog restart
sudo service rsyslog status
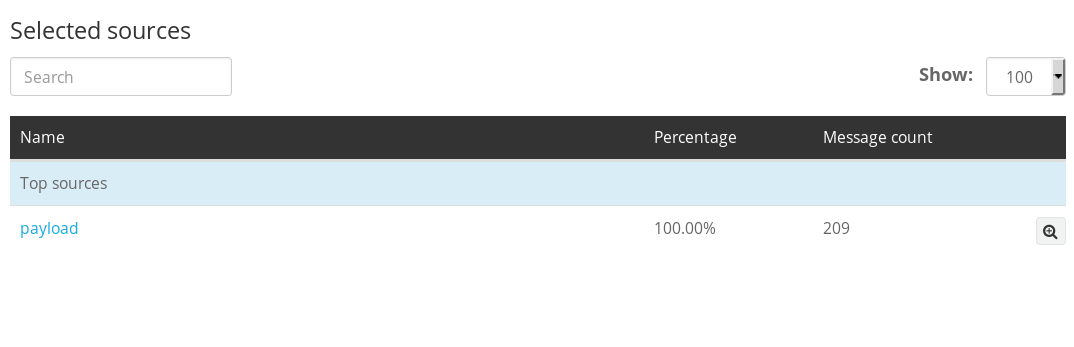
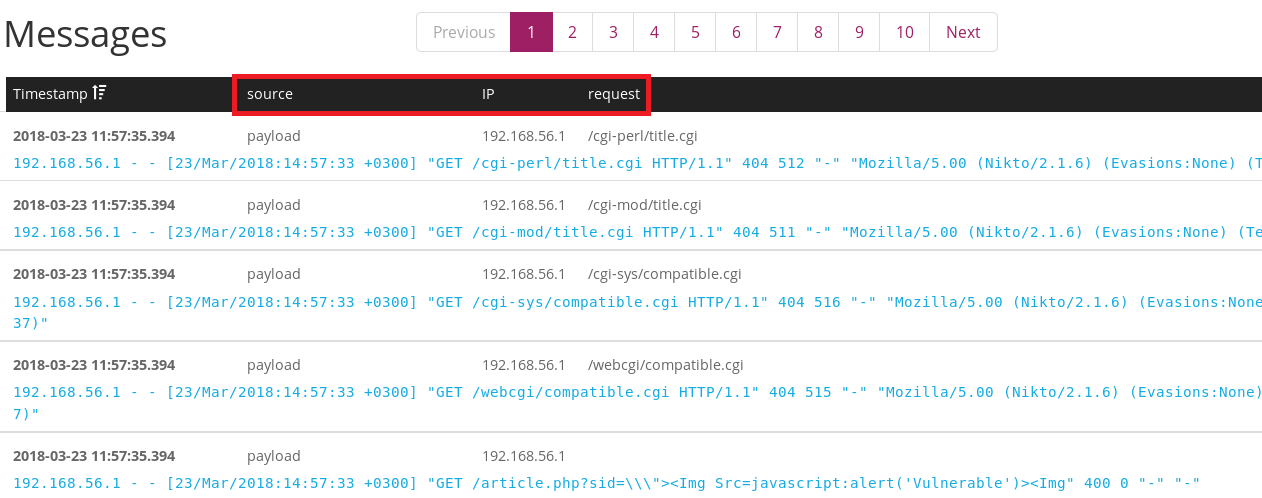
Let’s check if it’s working; go back to your Graylog server web administration and open the Sources menu. You should see the hostname/IP address of your Apache webserver in the list of sources.
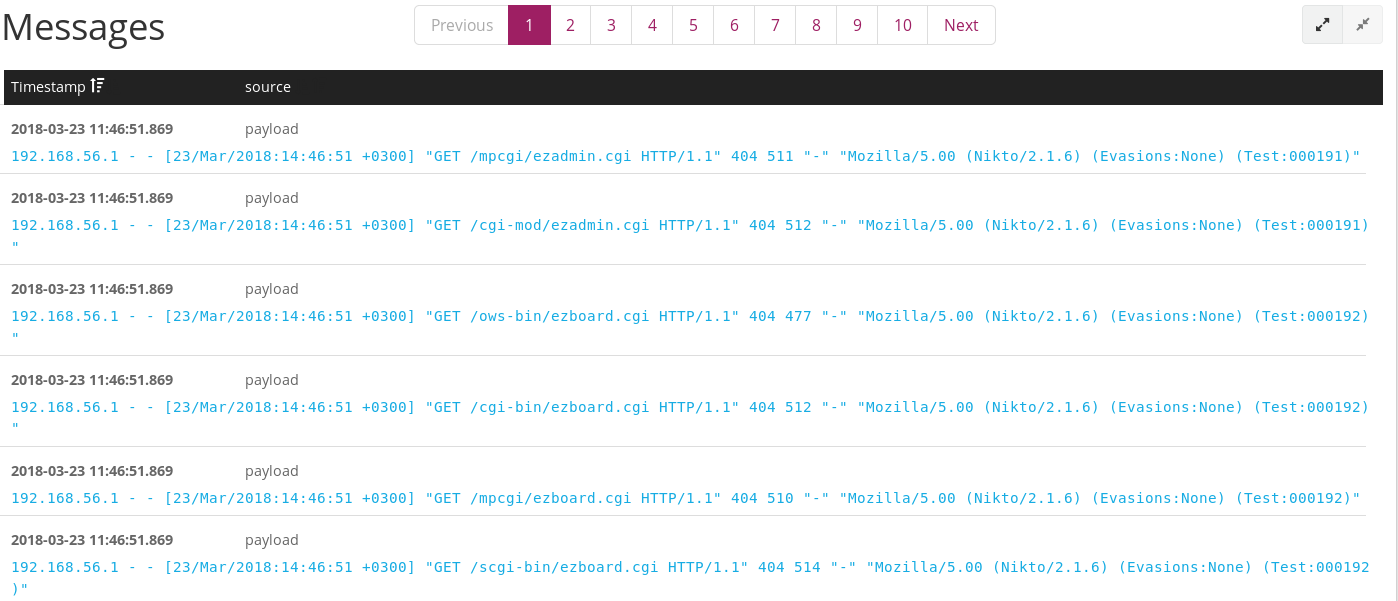
To verify that your Apache logs are actually being processed in real time, open Graylog’s Search menu and generate some Apache logs on your Apache client, how you do this is up to you; download a file from your server, Nikto scan it etc.
You should see your logs appearing in the Messages section of the Search menu.
Now all you have to do is repeat the steps above for all the Apache based infrastructure assets (payload servers, phishing servers, redirectors etc.) under your administration before moving on to the next step.
Server - Log parsing
By default, Graylog won’t appropriately parse Apache logs into a format that easily allows you to extract information from your inputs e.g. IP addresses, user agents, request string, response codes and so on. Right now the logs are coming in as raw unfiltered text which won’t allow us to analyse them easily.
We’ll fix this using Grok patterns.
i) Select a sample Apache log message
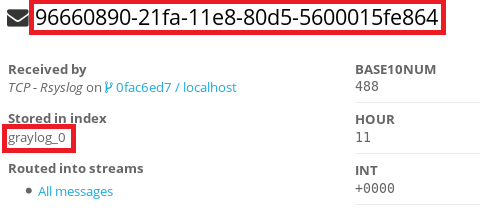
The first thing you’ll need to do is select any Apache log message from Graylog’s search menu to use as a sample. Click on it and take note of 2 values; the message ID string and the stored in index.
ii) Create an Apache log extractor
Next, head to the System→Inputs menu and click on the “Manage extractors” button next to your running Rsyslog input.
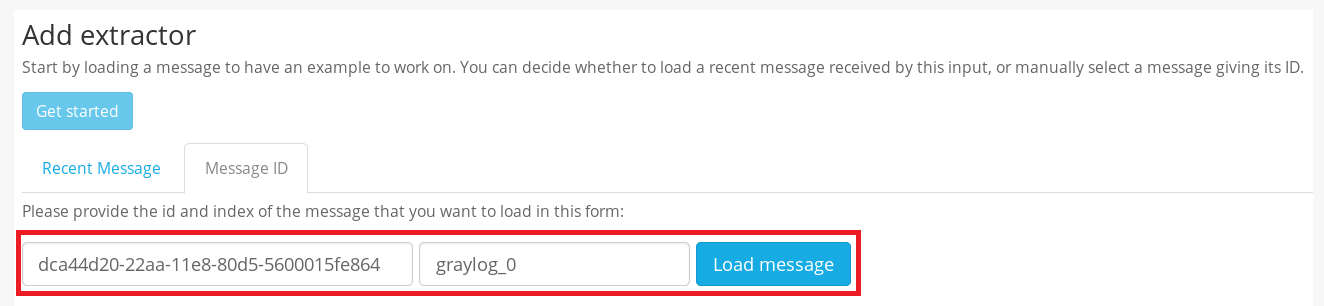
Click on “Get started” under the Add extractor menu then click on the Message ID tab. Paste the message ID string and the index you had extracted from your sample Apache log earlier.
Hit “Load message” when you’re done.
Your full Apache sample log should be loaded in the next window. Scroll to the “message” field and choose Grok pattern from the “Select extractor type” drop-down menu.
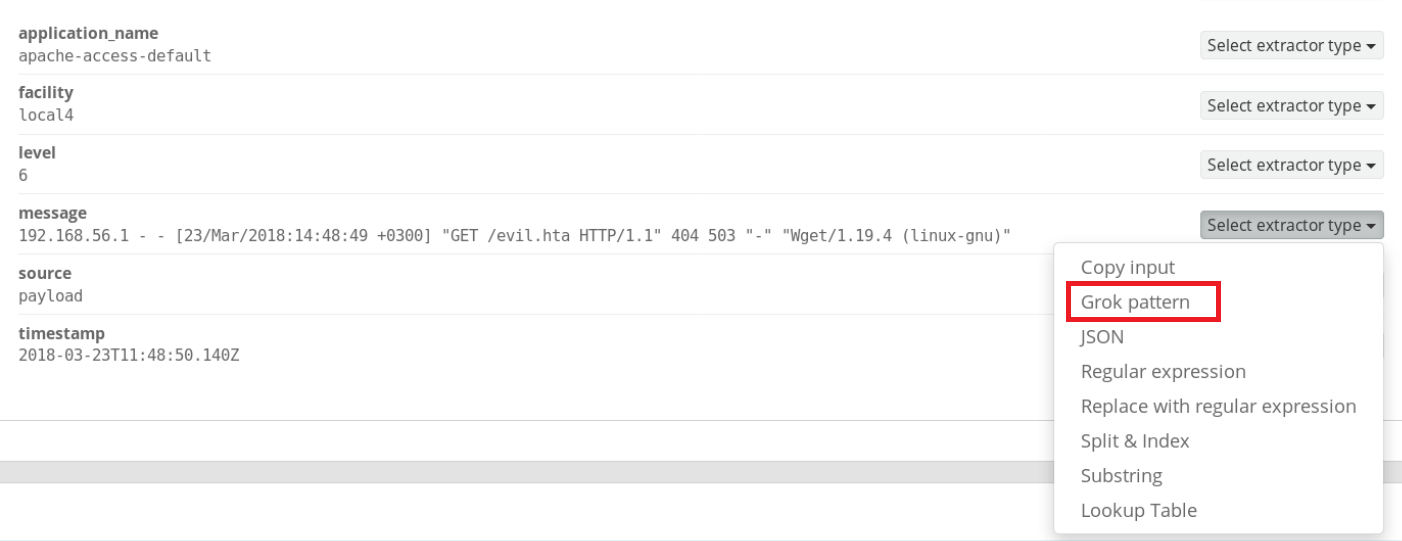
If everything’s gone well, you should see your sample Apache log in the Example message window. All you need to do now is paste the Grok pattern to parse it into the Grok pattern text-box.
Paste the entire string below into the text-box and hit the “Try” button beside it once you do:
%{IPORHOST:clientip} %{HTTPDUSER:ident} %{USER:auth} \[%{HTTPDATE:timestamp}\] "(?:%{WORD:verb} %{NOTSPACE:request}(?: HTTP/%{NUMBER:httpversion})?|%{DATA:rawrequest})" %{NUMBER:response} (?:%{NUMBER:bytes}|-)
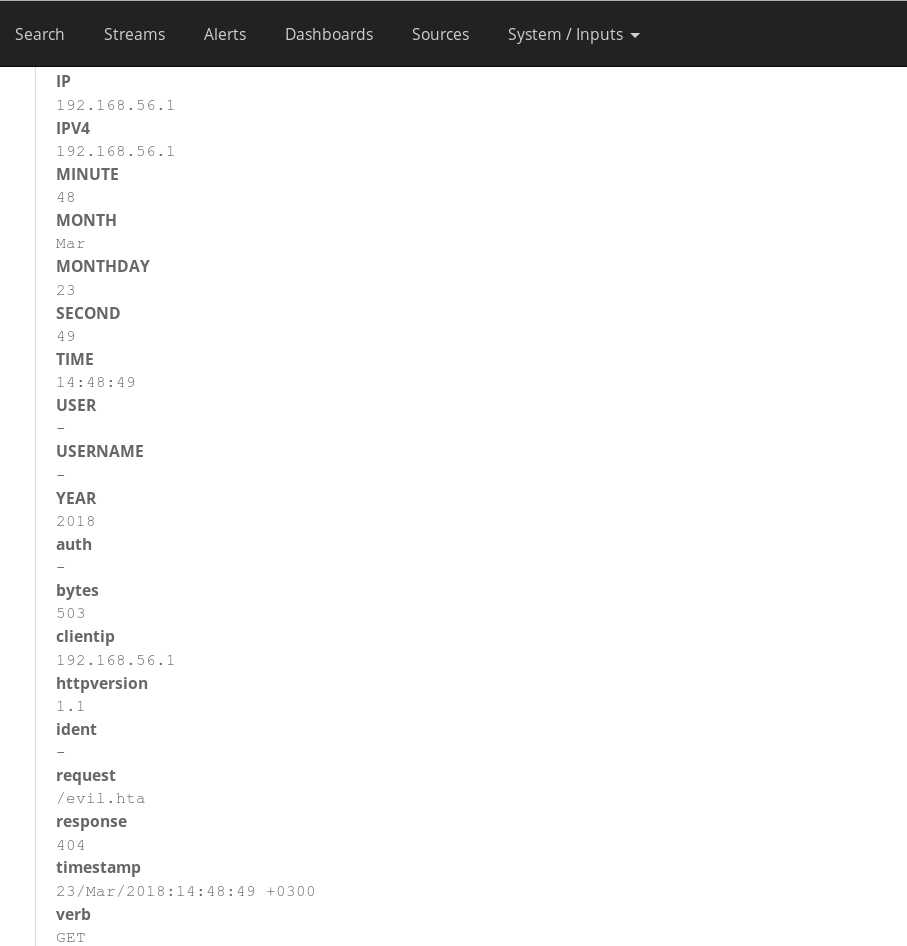
You should see your sample Apache log properly parsed into multiple fields in the “Extractor Preview” window.
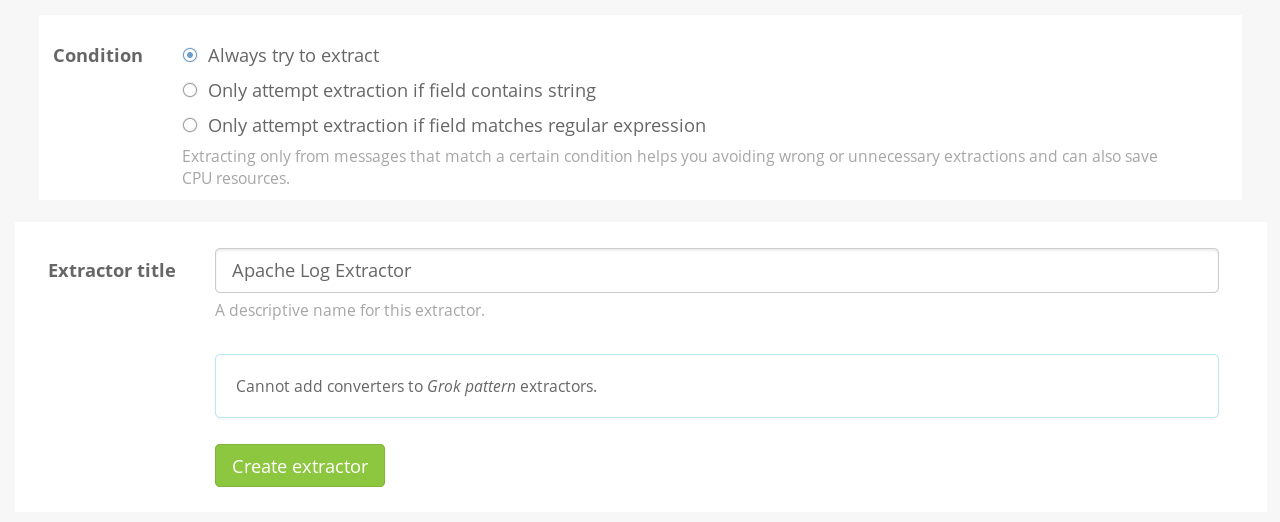
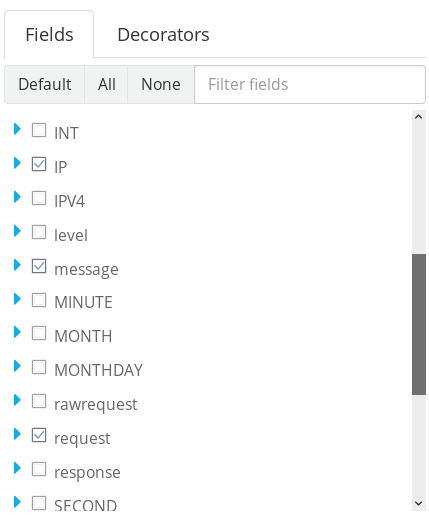
All you have to do now is give your extractor a name and click on the “Create extractor” button. Make sure the “Always try to extract” radio button is checked.
iii) Test it
Now all Apache logs coming into your logging server will be automatically parsed into multiple fields; making analysis much easier for you.
You can verify this by viewing new Apache logs in Graylog’s Search menu. Fields that didn’t exist before should now be available to you.
NOTE: Grok patterns are incredibly powerful and allow you to parse logs from all sorts of sources; web servers, mail servers and even custom applications. I’d definitely recommend checking out Graylog’s in-built Grok patterns under the System → Grok patterns menu. You can upload new Grok patterns from other sources or even write your own if you feel up to it.
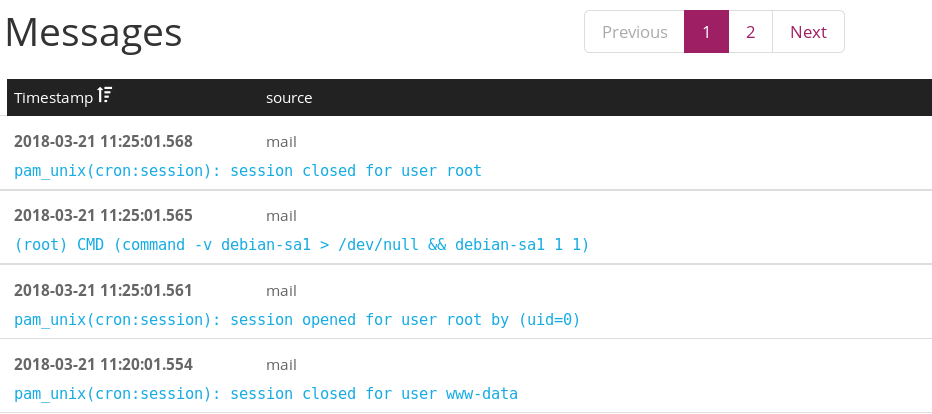
Client - Mail logs
Both Postfix and Sendmail write logs to the mail facility of syslog. Mail logs are typically stored in /var/log/maillog. They are also handled by Rsyslog’s configuration by default, unlike Apache webserver logs.
This is good for news for us, because all you have to do is edit the /etc/rsyslog.conf file in your mail server and add the line below to the bottom of the file.
# file: "/etc/rsyslog.conf"
*.* @@graylog.example.org:5140;RSYSLOG_SyslogProtocol23Format
Replace “graylog.example.org:5140” to match the details of your logging server.
Now just restart Rsyslog and your mail server’s logs should start appearing in Graylog.
sudo service syslog stop
sudo service rsyslog restart
sudo service rsyslog status
TIP: By default Postfix only captures the “From” and “To” details of outgoing emails in its log file. Follow the steps in this blog post to capture the subject of your emails as well for more detailed logging.
Extra - C2 logs
If you’re also interested in capturing logs from your Cobalt Strike C2 in Graylog, refer to the “Cobalt Strike Team Server Logging Client” section in this post and then use the Apache log aggregation instructions above to import your Cobalt Strike web logs into Graylog.
I honestly haven’t been able to figure out how to send Empire’s logs to Graylog, but if you’re using a redirector in front of your Empire C2, which you should be doing, then sending the redirector’s logs to Graylog should be enough.
Conclusion
Now we have a Graylog server receiving logs from multiple attack infrastructure assets. In the next post I’ll cover how to setup a dashboard to visualise some of this data.
References
- http://docs.graylog.org/en/2.4/pages/sending_data.html
- https://community.graylog.org/t/rsyslog-udp-works-but-not-syslog-tcp/2511
- https://github.com/Graylog2/graylog-guide-syslog-linux/blob/master/README.md#rsyslog
- http://www.rsyslog.com/sending-messages-to-a-remote-syslog-server/
- https://bluescreenofjeff.com/2017-08-08-attack-infrastructure-log-aggregation-and-monitoring/
- https://gist.github.com/GaryRogers/85c8f2a805010ceeccc6