Attack Infrastructure Logging - Part 4 - Log Event Alerting

Slack alerting in Graylog2.
- Attack Infra Logging
- Slack support
- Slack notifications
- Create an alert condition
- Test it
- Conclusion
- References
Attack Infra Logging
- Part 1: Logging Server Setup
- Part 2: Log Aggregation
- Part 3: Graylog Dashboard 101
- Part 4: Log Event Alerting
Quick recap; we setup a Graylog logging server, configured it to collect logs from multiple attack infrastructure assets and visualised some of this log data on a custom dashboard.
I’ll be wrapping up this blog series by demonstrating how we can configure Graylog to use Slack to alert us of infrastructure events immediately they occur.
Slack support
Slack alerting isn’t built into Graylog by default, but installing the plugin that adds this functionality only takes a couple of seconds. The Slack plugin can be found in the Graylog marketplace.
All we have to do is download the plugin, place the .jar file in Graylog’s plugin directory (/usr/share/graylog-server/plugin/ by default) and restart the Graylog service.
cd /usr/share/graylog-server/plugin/
sudo wget https://github.com/graylog-labs/graylog-plugin-slack/releases/download/3.0.1/graylog-plugin-slack-3.0.1.jar
sudo service graylog-server restart
Once Graylog successfully restarts the plugin will have been installed.
Slack notifications
I’m going to assume you already have a Slack workspace setup.
You should create a new channel to dedicate infrastructure alerts to. The channel I’m using for this demo can be found below.
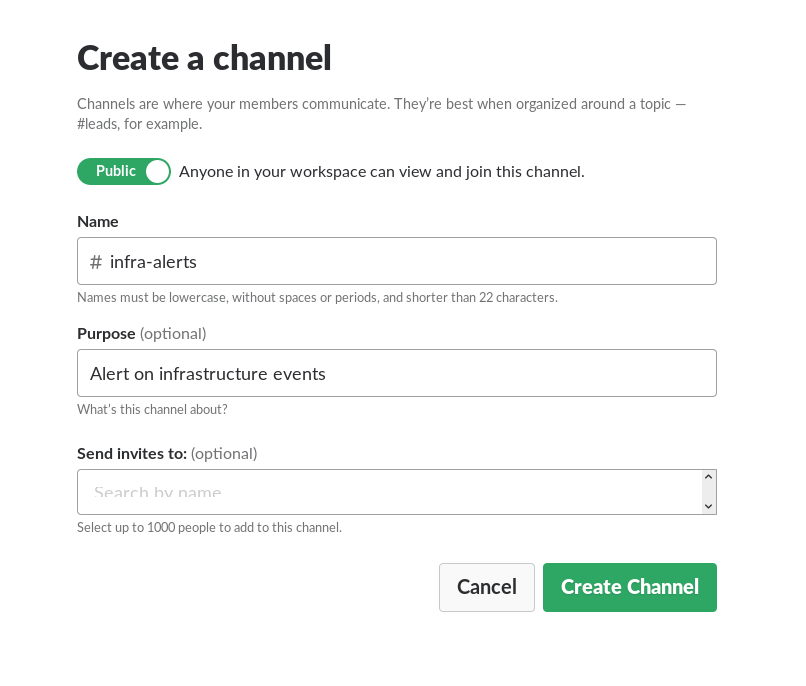
Create a new Slack Incoming Webhook by visiting the URL below:
https://[YOUR_WORKSPACE].slack.com/services/new/incoming-webhook
It will ask you to select a Slack channel, select the channel you created for infrastructure alerts.
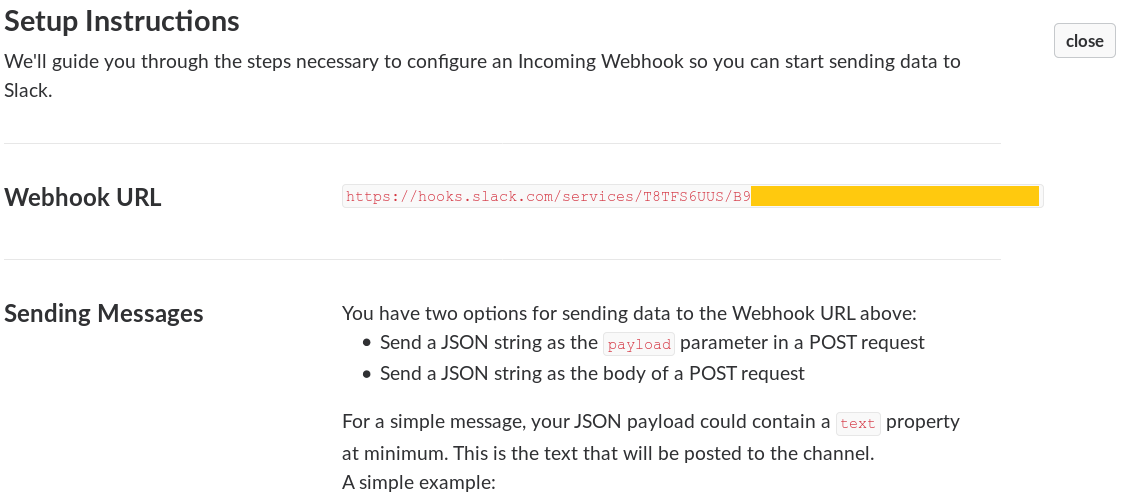
Copy the Webhook it generates for you and save it somewhere for later. You can also change the web integration username and icon if you’d like to. Hit Save settings at the bottom of the page when you’re done
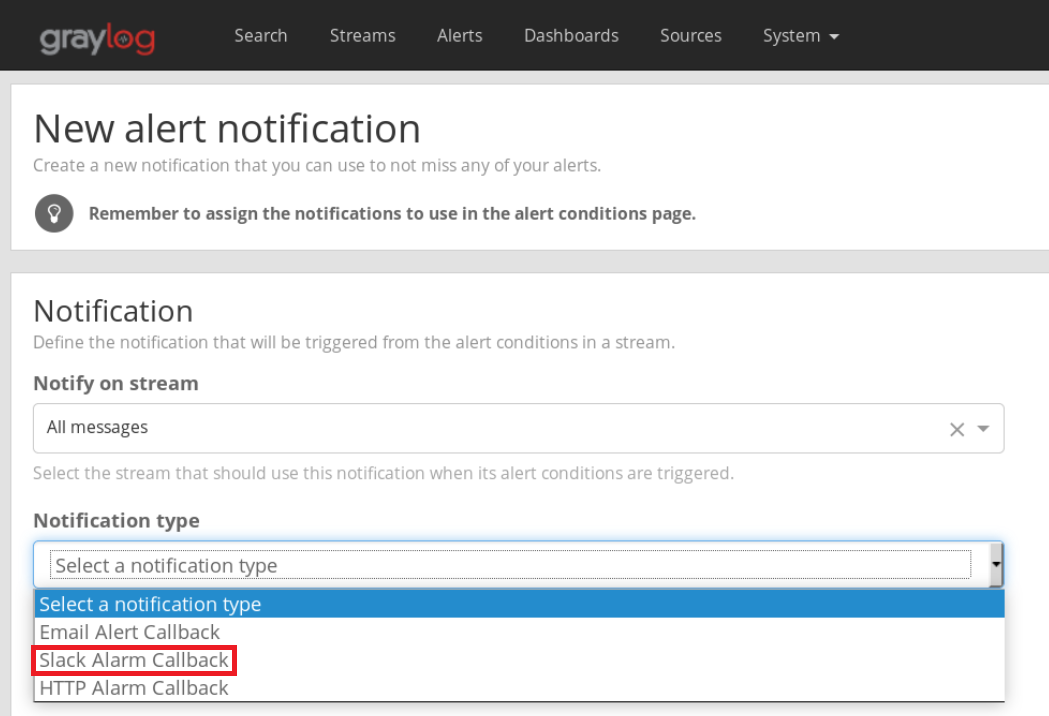
Once you have your webhook ready, head back to Graylog, navigate to the Alerts menu and click on the Manage notifications button.

Click on Add new notification and you should see the Slack Alarm Callback option in the drop down menu.
Give your alert a name, input the name of your Slack channel and paste the webhook value you had saved earlier.
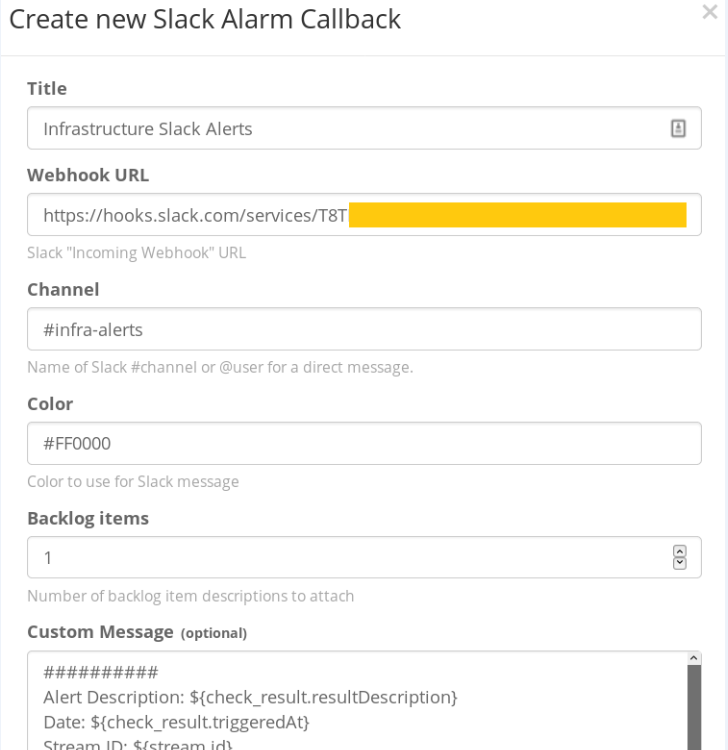
Hit save once you’re done. You can now Test the notification. If everything went well, you should have a new dummy notification in your infrastructure Slack channel.

Create an alert condition
I’m going to demonstrate Slack alerting on a payload download, but you can alert on any sort of activity you’d like to. Our alert condition in this situation will be a download of the “evil.hta” file stored in the “payloads” directory of my web server.
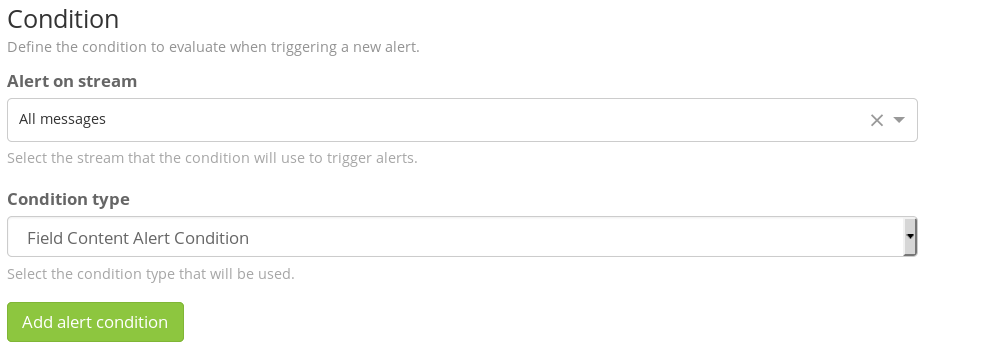
Head to the Alerts menu and click on Manage Conditions. Hit Add new condition on the page. Select the All messages stream in the next menu and Field Content Alert Condition as the condition type.
In the next menu, give your new condition a Title, type request in the Field box and /payloads/evil.hta (or whatever your payload directory and name is) in the Value field. Save the condition when finished.
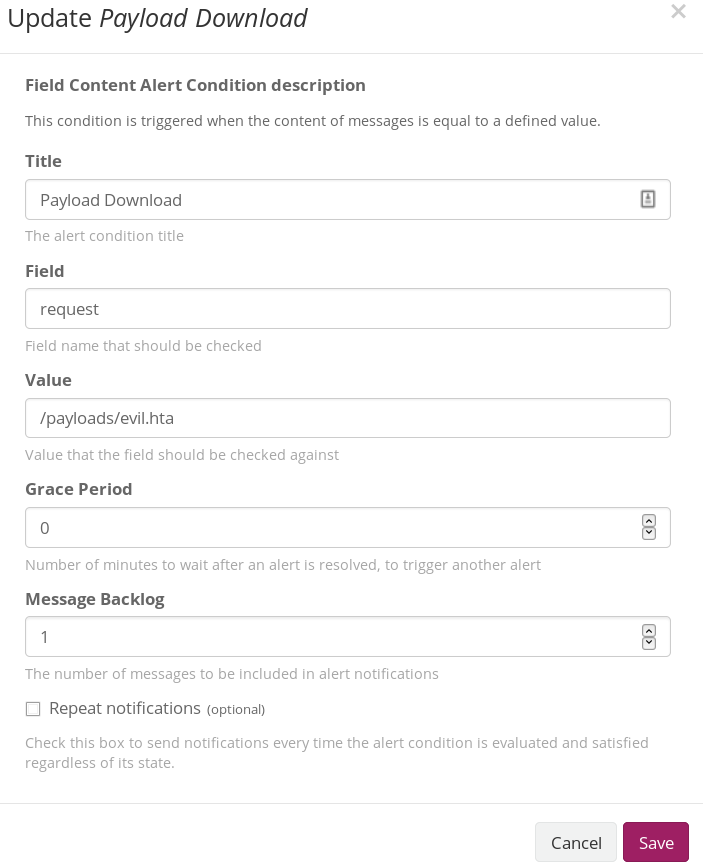
NOTE: Set the Message Backlog to 1 if you want the Apache log entry of your payload download to be appended to the Slack alert message.
Test it
If you’ve configured both your Condition and Notification appropriately, you should be able to test the payload download alert. Go to a browser/terminal and download your payload.
You should have a new Slack notification showing your download attempt 🙂

There might be a slight delay, so give the alert some time to register. The alert will also show up in Graylog’s Alerts menu.
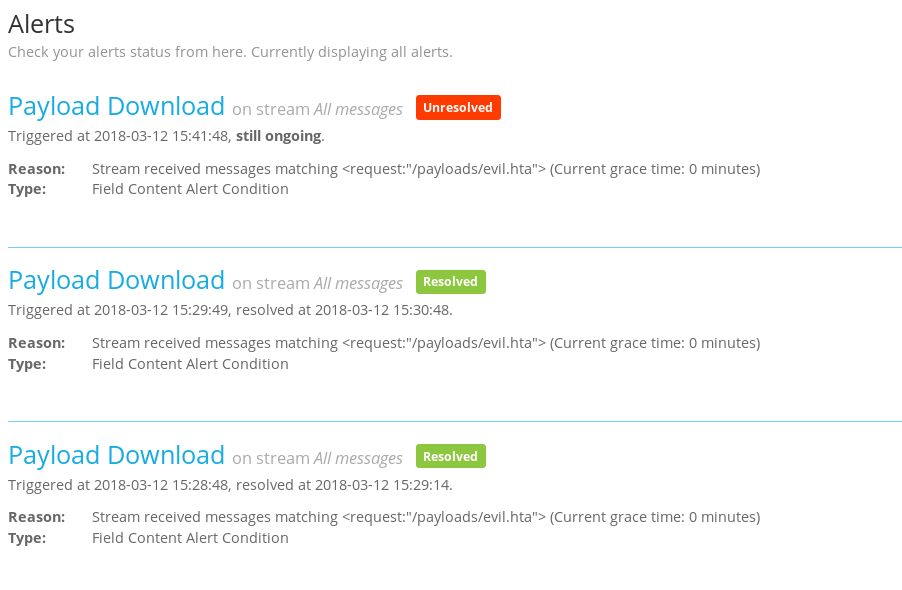
Now all you have to do is add as many new conditions to alert on as you want.
Some more alert ideas
- Successful phishes.
- Payload downloads/web requests from IR user agents e.g. wget, nc, curl, python etc.
- Web requests from known “bad IPs” e.g. AV vendor IP addresses.
- Successful logins to your infrastructure.
Conclusion
Finally here, the end of the infrastructure logging series.
Setting up centralised logging during long-term engagements can be a bit of a demanding process but it’s guaranteed to save you a lot more time and effort in the long run and provide you with a significant operational advantage that you wouldn’t have had if you were being overwhelmed by infrastructure logs from multiple sources.
